

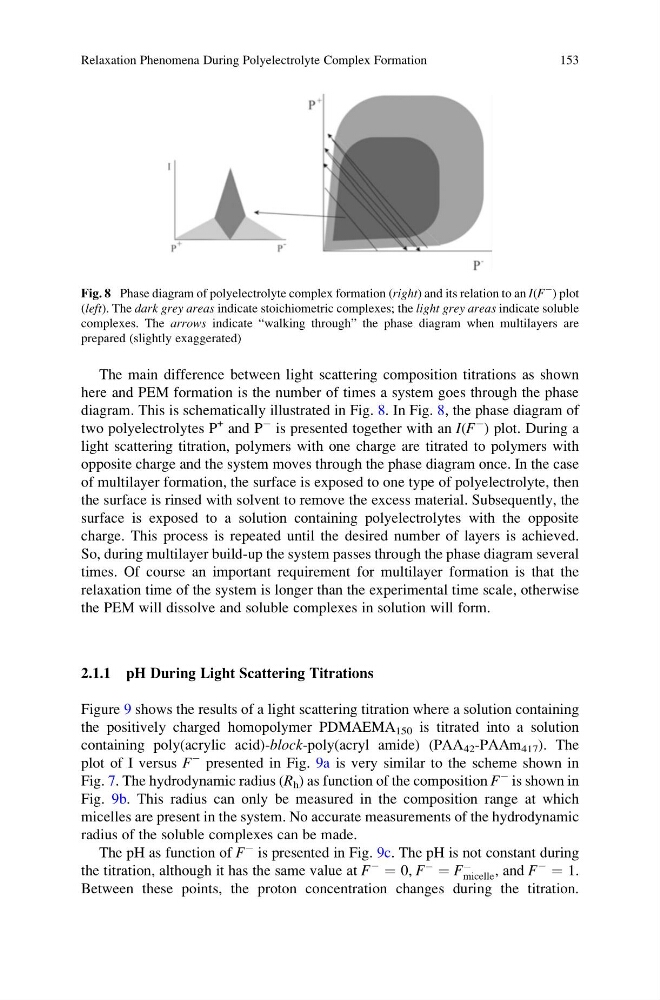
The main difference between light scattering composition titrations as shown
here and PEM formation is the number of times a system goes through the phase
diagram. This is schematically illustrated in Fig. 8. In Fig. 8, the phase diagram of
two polyelectrolytes P
+ and P
À is presented together with an I(F
À
) plot. During a
light scattering titration, polymers with one charge are titrated to polymers with
opposite charge and the system moves through the phase diagram once. In the case
of multilayer formation, the surface is exposed to one type of polyelectrolyte, then
the surface is rinsed with solvent to remove the excess material. Subsequently, the
surface is exposed to a solution containing polyelectrolytes with the opposite
charge. This process is repeated until the desired number of layers is achieved.
So, during multilayer build-up the system passes through the phase diagram several
times. Of course an important requirement for multilayer formation is that the
relaxation time of the system is longer than the experimental time scale, otherwise
the PEM will dissolve and soluble complexes in solution will form.
2.1.1 pH During Light Scattering Titrations
Figure 9 shows the results of a light scattering titration where a solution containing
the positively charged homopolymer PDMAEMA 150 is titrated into a solution
containing poly(acrylic acid)-block-poly(acryl amide) (PAA 42 -PAAm 417 ). The
plot of I versus F
À presented in Fig. 9a is very similar to the scheme shown in
Fig. 7. The hydrodynamic radius (R h ) as function of the composition F
À is shown in
Fig. 9b. This radius can only be measured in the composition range at which
micelles are present in the system. No accurate measurements of the hydrodynamic
radius of the soluble complexes can be made.
The pH as function of F
À is presented in Fig. 9c. The pH is not constant during
the titration, although it has the same value at F
À
¼ 0, F
À
¼ F
À
micelle , and F
À
¼ 1.
Between these points, the proton concentration changes during the titration.
Fig. 8 Phase diagram of polyelectrolyte complex formation (right) and its relation to an I(F
À ) plot
(left). The dark grey areas indicate stoichiometric complexes; the light grey areas indicate soluble
complexes. The arrows indicate “walking through” the phase diagram when multilayers are
prepared (slightly exaggerated)
Relaxation Phenomena During Polyelectrolyte Complex Formation
153
here and PEM formation is the number of times a system goes through the phase
diagram. This is schematically illustrated in Fig. 8. In Fig. 8, the phase diagram of
two polyelectrolytes P
+ and P
À is presented together with an I(F
À
) plot. During a
light scattering titration, polymers with one charge are titrated to polymers with
opposite charge and the system moves through the phase diagram once. In the case
of multilayer formation, the surface is exposed to one type of polyelectrolyte, then
the surface is rinsed with solvent to remove the excess material. Subsequently, the
surface is exposed to a solution containing polyelectrolytes with the opposite
charge. This process is repeated until the desired number of layers is achieved.
So, during multilayer build-up the system passes through the phase diagram several
times. Of course an important requirement for multilayer formation is that the
relaxation time of the system is longer than the experimental time scale, otherwise
the PEM will dissolve and soluble complexes in solution will form.
2.1.1 pH During Light Scattering Titrations
Figure 9 shows the results of a light scattering titration where a solution containing
the positively charged homopolymer PDMAEMA 150 is titrated into a solution
containing poly(acrylic acid)-block-poly(acryl amide) (PAA 42 -PAAm 417 ). The
plot of I versus F
À presented in Fig. 9a is very similar to the scheme shown in
Fig. 7. The hydrodynamic radius (R h ) as function of the composition F
À is shown in
Fig. 9b. This radius can only be measured in the composition range at which
micelles are present in the system. No accurate measurements of the hydrodynamic
radius of the soluble complexes can be made.
The pH as function of F
À is presented in Fig. 9c. The pH is not constant during
the titration, although it has the same value at F
À
¼ 0, F
À
¼ F
À
micelle , and F
À
¼ 1.
Between these points, the proton concentration changes during the titration.
Fig. 8 Phase diagram of polyelectrolyte complex formation (right) and its relation to an I(F
À ) plot
(left). The dark grey areas indicate stoichiometric complexes; the light grey areas indicate soluble
complexes. The arrows indicate “walking through” the phase diagram when multilayers are
prepared (slightly exaggerated)
Relaxation Phenomena During Polyelectrolyte Complex Formation
153