

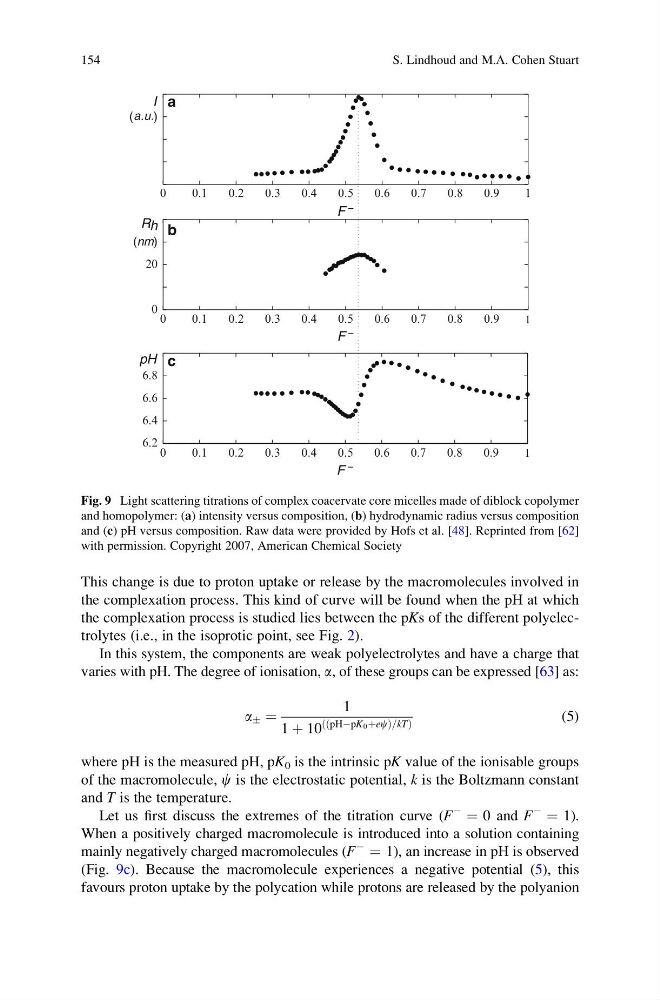
This change is due to proton uptake or release by the macromolecules involved in
the complexation process. This kind of curve will be found when the pH at which
the complexation process is studied lies between the pKs of the different polyelectrolytes (i.e., in the isoprotic point, see Fig. 2).
In this system, the components are weak polyelectrolytes and have a charge that
varies with pH. The degree of ionisation, a, of these groups can be expressed [63] as:
a Æ ¼
1
1 þ 10
ððpHÀpK 0 þecÞ=kTÞ
(5)
where pH is the measured pH, pK 0 is the intrinsic pK value of the ionisable groups
of the macromolecule, c is the electrostatic potential, k is the Boltzmann constant
and T is the temperature.
Let us first discuss the extremes of the titration curve (F
À ¼ 0 and F
À ¼ 1).
When a positively charged macromolecule is introduced into a solution containing
mainly negatively charged macromolecules (F
À
¼ 1), an increase in pH is observed
(Fig. 9c). Because the macromolecule experiences a negative potential (5), this
favours proton uptake by the polycation while protons are released by the polyanion
0
0.1
0.2
0.3
0.4
0.5
0.6
0.7
0.8
0.9
1
F −
0
0.1
0.2
0.3
0.4
0.5
0.6
0.7
0.8
0.9
1
6.2
6.4
6.6
6.8
F −
0
0.1
0.2
0.3
0.4
0.5
0.6
0.7
0.8
0.9
1
0
20
F −
a
c
b
I
R h
pH
(a.u.)
(nm)
Fig. 9 Light scattering titrations of complex coacervate core micelles made of diblock copolymer
and homopolymer: (a) intensity versus composition, (b) hydrodynamic radius versus composition
and (c) pH versus composition. Raw data were provided by Hofs et al. [48]. Reprinted from [62]
with permission. Copyright 2007, American Chemical Society
154
S. Lindhoud and M.A. Cohen Stuart
the complexation process. This kind of curve will be found when the pH at which
the complexation process is studied lies between the pKs of the different polyelectrolytes (i.e., in the isoprotic point, see Fig. 2).
In this system, the components are weak polyelectrolytes and have a charge that
varies with pH. The degree of ionisation, a, of these groups can be expressed [63] as:
a Æ ¼
1
1 þ 10
ððpHÀpK 0 þecÞ=kTÞ
(5)
where pH is the measured pH, pK 0 is the intrinsic pK value of the ionisable groups
of the macromolecule, c is the electrostatic potential, k is the Boltzmann constant
and T is the temperature.
Let us first discuss the extremes of the titration curve (F
À ¼ 0 and F
À ¼ 1).
When a positively charged macromolecule is introduced into a solution containing
mainly negatively charged macromolecules (F
À
¼ 1), an increase in pH is observed
(Fig. 9c). Because the macromolecule experiences a negative potential (5), this
favours proton uptake by the polycation while protons are released by the polyanion
0
0.1
0.2
0.3
0.4
0.5
0.6
0.7
0.8
0.9
1
F −
0
0.1
0.2
0.3
0.4
0.5
0.6
0.7
0.8
0.9
1
6.2
6.4
6.6
6.8
F −
0
0.1
0.2
0.3
0.4
0.5
0.6
0.7
0.8
0.9
1
0
20
F −
a
c
b
I
R h
pH
(a.u.)
(nm)
Fig. 9 Light scattering titrations of complex coacervate core micelles made of diblock copolymer
and homopolymer: (a) intensity versus composition, (b) hydrodynamic radius versus composition
and (c) pH versus composition. Raw data were provided by Hofs et al. [48]. Reprinted from [62]
with permission. Copyright 2007, American Chemical Society
154
S. Lindhoud and M.A. Cohen Stuart