

These particles are called by several names in literature: block ionomer complexes
[57], polyion complex micelles [58], complex coacervate core micelles [59] and
polyelectrolyte complex micelles. An extensive review of this type of micelle has
been written by Voets et al. [60].
During a light scattering titration, the scattered intensity can be studied as
function of the composition (F
À
):
F
À
¼ 1 À F
þ
¼
½n À
½n À þ ½n þ
(4)
Plots of light scattering intensity (I/C) versus F
À (where I/C is the light
scattering normalised with respect to the polymer concentration) were first reported
and discussed by Van der Burgh et al. [61]. For the systems they studied, a
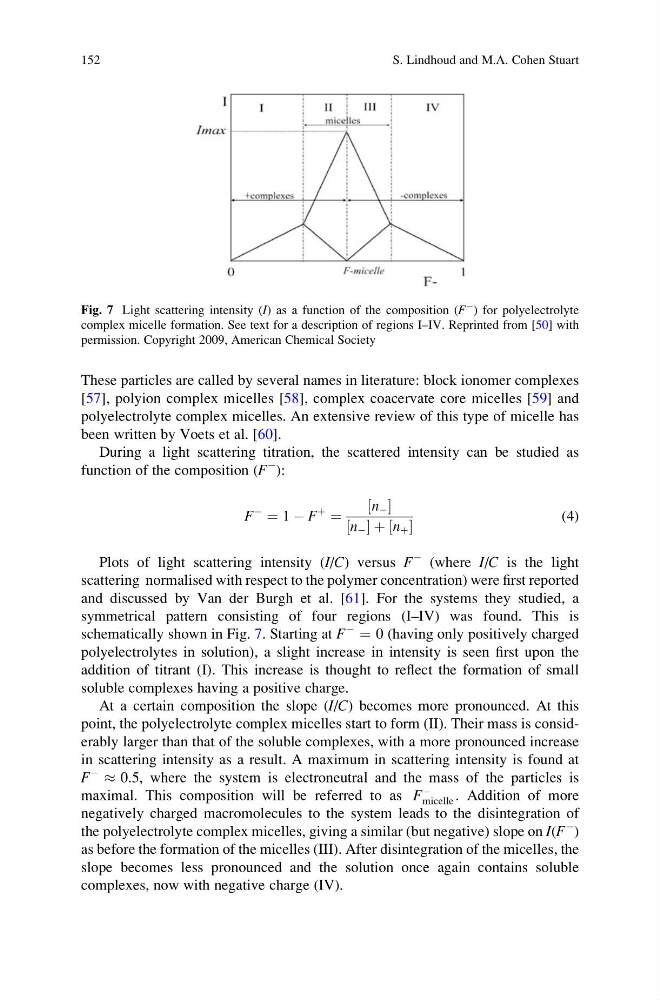
symmetrical pattern consisting of four regions (I–IV) was found. This is
schematically shown in Fig. 7. Starting at F
À
¼ 0 (having only positively charged
polyelectrolytes in solution), a slight increase in intensity is seen first upon the
addition of titrant (I). This increase is thought to reflect the formation of small
soluble complexes having a positive charge.
At a certain composition the slope (I/C) becomes more pronounced. At this
point, the polyelectrolyte complex micelles start to form (II). Their mass is considerably larger than that of the soluble complexes, with a more pronounced increase
in scattering intensity as a result. A maximum in scattering intensity is found at
F
À
% 0.5, where the system is electroneutral and the mass of the particles is
maximal. This composition will be referred to as F
À
micelle . Addition of more
negatively charged macromolecules to the system leads to the disintegration of
the polyelectrolyte complex micelles, giving a similar (but negative) slope on I(F
À
)
as before the formation of the micelles (III). After disintegration of the micelles, the
slope becomes less pronounced and the solution once again contains soluble
complexes, now with negative charge (IV).
Fig. 7 Light scattering intensity (I) as a function of the composition (F
À ) for polyelectrolyte
complex micelle formation. See text for a description of regions I–IV. Reprinted from [50] with
permission. Copyright 2009, American Chemical Society
152
S. Lindhoud and M.A. Cohen Stuart
[57], polyion complex micelles [58], complex coacervate core micelles [59] and
polyelectrolyte complex micelles. An extensive review of this type of micelle has
been written by Voets et al. [60].
During a light scattering titration, the scattered intensity can be studied as
function of the composition (F
À
):
F
À
¼ 1 À F
þ
¼
½n À
½n À þ ½n þ
(4)
Plots of light scattering intensity (I/C) versus F
À (where I/C is the light
scattering normalised with respect to the polymer concentration) were first reported
and discussed by Van der Burgh et al. [61]. For the systems they studied, a
symmetrical pattern consisting of four regions (I–IV) was found. This is
schematically shown in Fig. 7. Starting at F
À
¼ 0 (having only positively charged
polyelectrolytes in solution), a slight increase in intensity is seen first upon the
addition of titrant (I). This increase is thought to reflect the formation of small
soluble complexes having a positive charge.
At a certain composition the slope (I/C) becomes more pronounced. At this
point, the polyelectrolyte complex micelles start to form (II). Their mass is considerably larger than that of the soluble complexes, with a more pronounced increase
in scattering intensity as a result. A maximum in scattering intensity is found at
F
À
% 0.5, where the system is electroneutral and the mass of the particles is
maximal. This composition will be referred to as F
À
micelle . Addition of more
negatively charged macromolecules to the system leads to the disintegration of
the polyelectrolyte complex micelles, giving a similar (but negative) slope on I(F
À
)
as before the formation of the micelles (III). After disintegration of the micelles, the
slope becomes less pronounced and the solution once again contains soluble
complexes, now with negative charge (IV).
Fig. 7 Light scattering intensity (I) as a function of the composition (F
À ) for polyelectrolyte
complex micelle formation. See text for a description of regions I–IV. Reprinted from [50] with
permission. Copyright 2009, American Chemical Society
152
S. Lindhoud and M.A. Cohen Stuart