

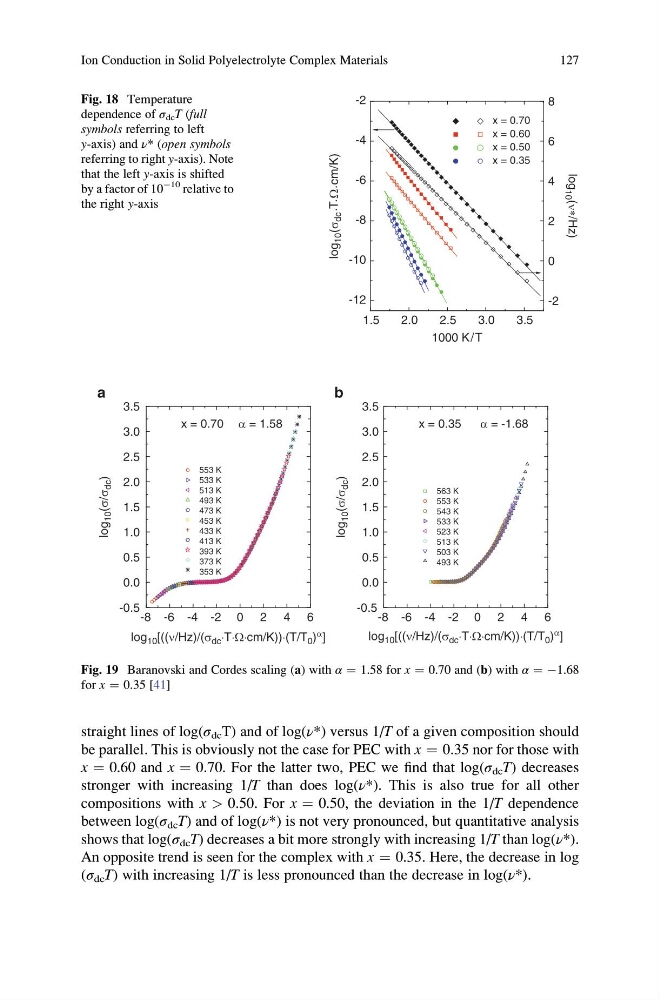
straight lines of log(σ dc T) and of log(ν*) versus 1/T of a given composition should
be parallel. This is obviously not the case for PEC with x ¼ 0.35 nor for those with
x ¼ 0.60 and x ¼ 0.70. For the latter two, PEC we find that log(σ dc T) decreases
stronger with increasing 1/T than does log(ν*). This is also true for all other
compositions with x > 0.50. For x ¼ 0.50, the deviation in the 1/T dependence
between log(σ dc T) and of log(ν*) is not very pronounced, but quantitative analysis
shows that log(σ dc T) decreases a bit more strongly with increasing 1/T than log(ν*).
An opposite trend is seen for the complex with x ¼ 0.35. Here, the decrease in log
(σ dc T) with increasing 1/T is less pronounced than the decrease in log(ν*).
1.5
2.0
2.5
3.0
3.5
-12
-10
-8
-6
-4
-2
x = 0.70
x = 0.60
x = 0.50
x = 0.35
1000 K/T
-2
0
2
4
6
8
log 10 (ν∗/Hz)
log
10 (σ
dc •T•
Ω •
cm/K)
Fig. 18 Temperature
dependence of σ dc T (full
symbols referring to left
y-axis) and ν* (open symbols
referring to right y-axis). Note
that the left y-axis is shifted
by a factor of 10
À10 relative to
the right y-axis
-8 -6 -4 -2 0 2 4 6
-0.5
0.0
0.5
1.0
1.5
2.0
2.5
3.0
3.5
563 K
553 K
543 K
533 K
523 K
513 K
503 K
493 K
b
x = 0.35
-8 -6 -4 -2 0 2 4 6
-0.5
0.0
0.5
1.0
1.5
2.0
2.5
3.0
3.5
553 K
533 K
513 K
493 K
473 K
453 K
433 K
413 K
393 K
373 K
353 K
log
10 (σ/σ
dc )
log
10 (σ/σ
dc )
log 10 [((ν/Hz)/(σ dc ⋅T⋅Ω⋅cm/K))⋅(T/T 0 ) α ]
log 10 [((ν/Hz)/(σ dc ⋅T⋅Ω⋅cm/K))⋅(T/T 0 )
α
]
a
x = 0.70 α = 1.58
α = -1.68
Fig. 19 Baranovski and Cordes scaling (a) with α ¼ 1.58 for x ¼ 0.70 and (b) with α ¼ À1.68
for x ¼ 0.35 [41]
Ion Conduction in Solid Polyelectrolyte Complex Materials
127
be parallel. This is obviously not the case for PEC with x ¼ 0.35 nor for those with
x ¼ 0.60 and x ¼ 0.70. For the latter two, PEC we find that log(σ dc T) decreases
stronger with increasing 1/T than does log(ν*). This is also true for all other
compositions with x > 0.50. For x ¼ 0.50, the deviation in the 1/T dependence
between log(σ dc T) and of log(ν*) is not very pronounced, but quantitative analysis
shows that log(σ dc T) decreases a bit more strongly with increasing 1/T than log(ν*).
An opposite trend is seen for the complex with x ¼ 0.35. Here, the decrease in log
(σ dc T) with increasing 1/T is less pronounced than the decrease in log(ν*).
1.5
2.0
2.5
3.0
3.5
-12
-10
-8
-6
-4
-2
x = 0.70
x = 0.60
x = 0.50
x = 0.35
1000 K/T
-2
0
2
4
6
8
log 10 (ν∗/Hz)
log
10 (σ
dc •T•
Ω •
cm/K)
Fig. 18 Temperature
dependence of σ dc T (full
symbols referring to left
y-axis) and ν* (open symbols
referring to right y-axis). Note
that the left y-axis is shifted
by a factor of 10
À10 relative to
the right y-axis
-8 -6 -4 -2 0 2 4 6
-0.5
0.0
0.5
1.0
1.5
2.0
2.5
3.0
3.5
563 K
553 K
543 K
533 K
523 K
513 K
503 K
493 K
b
x = 0.35
-8 -6 -4 -2 0 2 4 6
-0.5
0.0
0.5
1.0
1.5
2.0
2.5
3.0
3.5
553 K
533 K
513 K
493 K
473 K
453 K
433 K
413 K
393 K
373 K
353 K
log
10 (σ/σ
dc )
log
10 (σ/σ
dc )
log 10 [((ν/Hz)/(σ dc ⋅T⋅Ω⋅cm/K))⋅(T/T 0 ) α ]
log 10 [((ν/Hz)/(σ dc ⋅T⋅Ω⋅cm/K))⋅(T/T 0 )
α
]
a
x = 0.70 α = 1.58
α = -1.68
Fig. 19 Baranovski and Cordes scaling (a) with α ¼ 1.58 for x ¼ 0.70 and (b) with α ¼ À1.68
for x ¼ 0.35 [41]
Ion Conduction in Solid Polyelectrolyte Complex Materials
127