

The temperature dependence of the onset frequencies ν* for all complex
compositions can be described by the Baranovski–Cordes scaling function, which
means that νà / σ dc Á T Á T
Àα
¼ σ dc Á T
1Àα , but the sign and the absolute values of α
differ strongly with composition.
Figure 19 shows two examples for sets of conductivity spectra of PEC, which
have been scaled according to Baranovskii and Cordes [73], each set with a
different α-value. The spectra for x ¼ 0.70 can, indeed, be nicely superimposed
to a master curve (see Fig. 19a); the TTSP is very well fulfilled. For x ¼ 0.35, the
superimposed spectra of Fig. 19b show slight deviations at very high normalized
frequencies, but the spectral shape is independent of temperature for several
decades on the frequency scale, even far above the onset of dispersion.
From these and other results [41], it is concluded that the TTSP is valid in the
complete measured frequency/temperature range for x > 0.50 and in a limited
frequency range for x < 0.50. However, σ dc T and ν* have distinct temperature
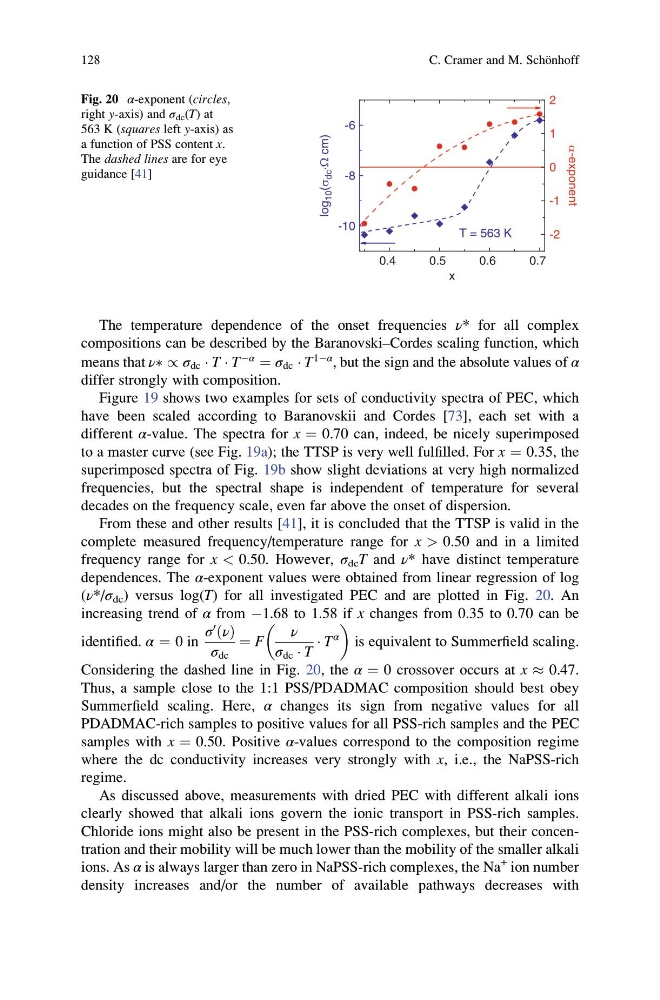
dependences. The α-exponent values were obtained from linear regression of log
(ν*/σ dc ) versus log(T) for all investigated PEC and are plotted in Fig. 20. An
increasing trend of α from À1.68 to 1.58 if x changes from 0.35 to 0.70 can be
identified. α ¼ 0 in
σ
0
ðνÞ
σ dc
¼ F
ν
σ dc Á T
Á T
α
is equivalent to Summerfield scaling.
Considering the dashed line in Fig. 20, the α ¼ 0 crossover occurs at x % 0.47.
Thus, a sample close to the 1:1 PSS/PDADMAC composition should best obey
Summerfield scaling. Here, α changes its sign from negative values for all
PDADMAC-rich samples to positive values for all PSS-rich samples and the PEC
samples with x ¼ 0.50. Positive α-values correspond to the composition regime
where the dc conductivity increases very strongly with x, i.e., the NaPSS-rich
regime.
As discussed above, measurements with dried PEC with different alkali ions
clearly showed that alkali ions govern the ionic transport in PSS-rich samples.
Chloride ions might also be present in the PSS-rich complexes, but their concentration and their mobility will be much lower than the mobility of the smaller alkali
ions. As α is always larger than zero in NaPSS-rich complexes, the Na
+ ion number
density increases and/or the number of available pathways decreases with
0.4
0.5
0.6
0.7
-10
-8
-6
x
T = 563 K
-2
-1
0
1
2
a-exponent
log
10 (σ
dc ×Ω cm)
Fig. 20 α-exponent (circles,
right y-axis) and σ dc (T) at
563 K (squares left y-axis) as
a function of PSS content x.
The dashed lines are for eye
guidance [41]
128
C. Cramer and M. Scho ¨nhoff
compositions can be described by the Baranovski–Cordes scaling function, which
means that νà / σ dc Á T Á T
Àα
¼ σ dc Á T
1Àα , but the sign and the absolute values of α
differ strongly with composition.
Figure 19 shows two examples for sets of conductivity spectra of PEC, which
have been scaled according to Baranovskii and Cordes [73], each set with a
different α-value. The spectra for x ¼ 0.70 can, indeed, be nicely superimposed
to a master curve (see Fig. 19a); the TTSP is very well fulfilled. For x ¼ 0.35, the
superimposed spectra of Fig. 19b show slight deviations at very high normalized
frequencies, but the spectral shape is independent of temperature for several
decades on the frequency scale, even far above the onset of dispersion.
From these and other results [41], it is concluded that the TTSP is valid in the
complete measured frequency/temperature range for x > 0.50 and in a limited
frequency range for x < 0.50. However, σ dc T and ν* have distinct temperature
dependences. The α-exponent values were obtained from linear regression of log
(ν*/σ dc ) versus log(T) for all investigated PEC and are plotted in Fig. 20. An
increasing trend of α from À1.68 to 1.58 if x changes from 0.35 to 0.70 can be
identified. α ¼ 0 in
σ
0
ðνÞ
σ dc
¼ F
ν
σ dc Á T
Á T
α
is equivalent to Summerfield scaling.
Considering the dashed line in Fig. 20, the α ¼ 0 crossover occurs at x % 0.47.
Thus, a sample close to the 1:1 PSS/PDADMAC composition should best obey
Summerfield scaling. Here, α changes its sign from negative values for all
PDADMAC-rich samples to positive values for all PSS-rich samples and the PEC
samples with x ¼ 0.50. Positive α-values correspond to the composition regime
where the dc conductivity increases very strongly with x, i.e., the NaPSS-rich
regime.
As discussed above, measurements with dried PEC with different alkali ions
clearly showed that alkali ions govern the ionic transport in PSS-rich samples.
Chloride ions might also be present in the PSS-rich complexes, but their concentration and their mobility will be much lower than the mobility of the smaller alkali
ions. As α is always larger than zero in NaPSS-rich complexes, the Na
+ ion number
density increases and/or the number of available pathways decreases with
0.4
0.5
0.6
0.7
-10
-8
-6
x
T = 563 K
-2
-1
0
1
2
a-exponent
log
10 (σ
dc ×Ω cm)
Fig. 20 α-exponent (circles,
right y-axis) and σ dc (T) at
563 K (squares left y-axis) as
a function of PSS content x.
The dashed lines are for eye
guidance [41]
128
C. Cramer and M. Scho ¨nhoff