

Because conductivity values and activation enthalpies derived from the first
measurement series do not show any systematic dependence on composition nor
on the kind of alkali cation, they seem to be determined by an arbitrary amount of
residual water. In contrast, the dc conductivity and enthalpy values determined for
dried PEC remain unaffected by further heating or cooling processes and show clear
trends. The loss of water generally lowers the ionic conductivity of dried PEC by
several orders of magnitude compared to as-prepared PEC. In addition to cations or
anions, protons or hydronium ions might contribute to the dc conductivity of the
non-annealed PEC samples determined in the first heating run.
For all types of alkali PEC, the residual water appears to have a large effect on the
charge carrier mobility, enhancing it by several orders of magnitude. In accordance
with this, the activation enthalpy is lower for water-containing PEC. An explanation
for both effects and a detailed picture of the influence of water on ion transport is
given in Sect. 4, where systematic studies at controlled RH are described.
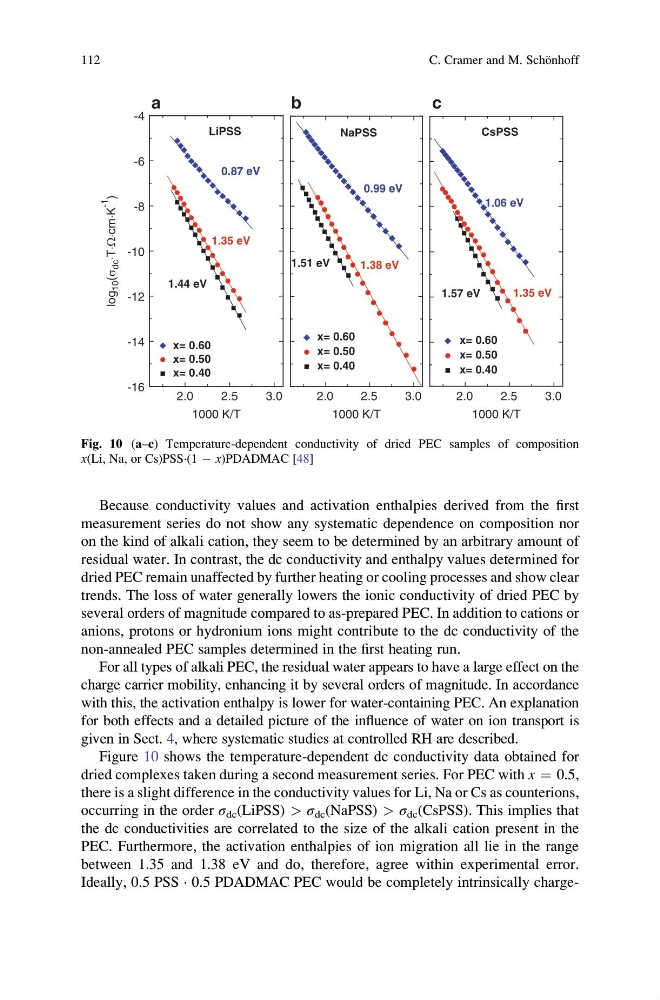
Figure 10 shows the temperature-dependent dc conductivity data obtained for
dried complexes taken during a second measurement series. For PEC with x ¼ 0.5,
there is a slight difference in the conductivity values for Li, Na or Cs as counterions,
occurring in the order σ dc (LiPSS) > σ dc (NaPSS) > σ dc (CsPSS). This implies that
the dc conductivities are correlated to the size of the alkali cation present in the
PEC. Furthermore, the activation enthalpies of ion migration all lie in the range
between 1.35 and 1.38 eV and do, therefore, agree within experimental error.
Ideally, 0.5 PSS · 0.5 PDADMAC PEC would be completely intrinsically charge2.0
2.5
3.0
-16
-14
-12
-10
-8
-6
-4
x= 0.60
x= 0.50
x= 0.40
log
10 (σ
dc ⋅T⋅Ω⋅cm⋅K
-1
)
1.44 eV
1.35 eV
0.87 eV
1000 K/T
a
LiPSS
2.0
2.5
3.0
x= 0.60
x= 0.50
x= 0.40
c
CsPSS
1000 K/T
1.57 eV
1.06 eV
1.35 eV
2.0
2.5
3.0
b
NaPSS
1000 K/T
x= 0.60
x= 0.50
x= 0.40
1.51 eV
0.99 eV
1.38 eV
Fig. 10 (a–c) Temperature-dependent conductivity of dried PEC samples of composition
x(Li, Na, or Cs)PSS·(1 À x)PDADMAC [48]
112
C. Cramer and M. Scho ¨nhoff
measurement series do not show any systematic dependence on composition nor
on the kind of alkali cation, they seem to be determined by an arbitrary amount of
residual water. In contrast, the dc conductivity and enthalpy values determined for
dried PEC remain unaffected by further heating or cooling processes and show clear
trends. The loss of water generally lowers the ionic conductivity of dried PEC by
several orders of magnitude compared to as-prepared PEC. In addition to cations or
anions, protons or hydronium ions might contribute to the dc conductivity of the
non-annealed PEC samples determined in the first heating run.
For all types of alkali PEC, the residual water appears to have a large effect on the
charge carrier mobility, enhancing it by several orders of magnitude. In accordance
with this, the activation enthalpy is lower for water-containing PEC. An explanation
for both effects and a detailed picture of the influence of water on ion transport is
given in Sect. 4, where systematic studies at controlled RH are described.
Figure 10 shows the temperature-dependent dc conductivity data obtained for
dried complexes taken during a second measurement series. For PEC with x ¼ 0.5,
there is a slight difference in the conductivity values for Li, Na or Cs as counterions,
occurring in the order σ dc (LiPSS) > σ dc (NaPSS) > σ dc (CsPSS). This implies that
the dc conductivities are correlated to the size of the alkali cation present in the
PEC. Furthermore, the activation enthalpies of ion migration all lie in the range
between 1.35 and 1.38 eV and do, therefore, agree within experimental error.
Ideally, 0.5 PSS · 0.5 PDADMAC PEC would be completely intrinsically charge2.0
2.5
3.0
-16
-14
-12
-10
-8
-6
-4
x= 0.60
x= 0.50
x= 0.40
log
10 (σ
dc ⋅T⋅Ω⋅cm⋅K
-1
)
1.44 eV
1.35 eV
0.87 eV
1000 K/T
a
LiPSS
2.0
2.5
3.0
x= 0.60
x= 0.50
x= 0.40
c
CsPSS
1000 K/T
1.57 eV
1.06 eV
1.35 eV
2.0
2.5
3.0
b
NaPSS
1000 K/T
x= 0.60
x= 0.50
x= 0.40
1.51 eV
0.99 eV
1.38 eV
Fig. 10 (a–c) Temperature-dependent conductivity of dried PEC samples of composition
x(Li, Na, or Cs)PSS·(1 À x)PDADMAC [48]
112
C. Cramer and M. Scho ¨nhoff