

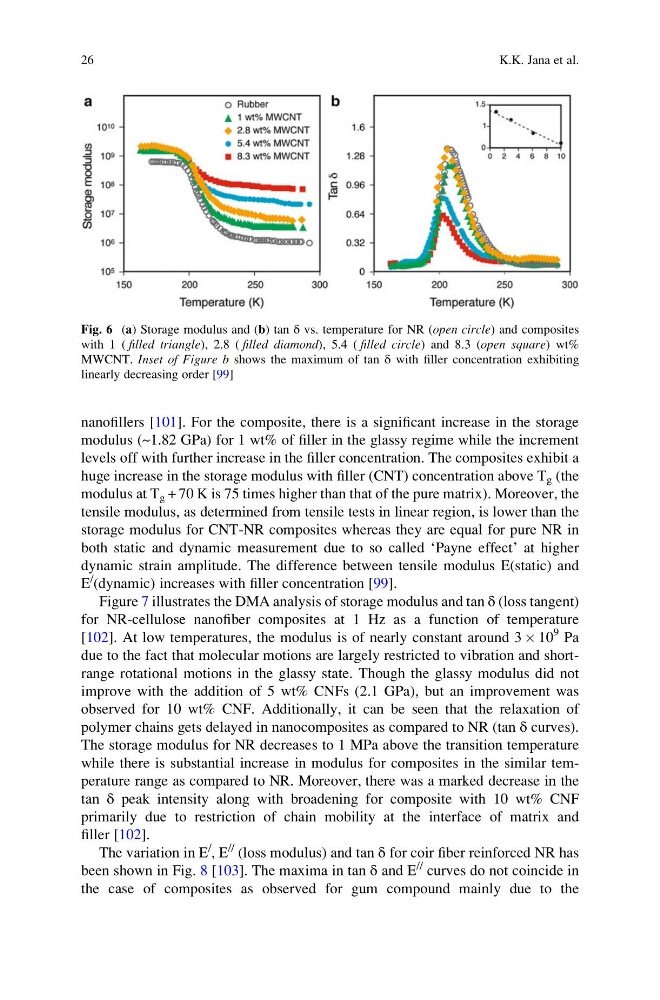
nanofillers [101]. For the composite, there is a significant increase in the storage
modulus (~1.82 GPa) for 1 wt% of filler in the glassy regime while the increment
levels off with further increase in the filler concentration. The composites exhibit a
huge increase in the storage modulus with filler (CNT) concentration above T g (the
modulus at T g + 70 K is 75 times higher than that of the pure matrix). Moreover, the
tensile modulus, as determined from tensile tests in linear region, is lower than the
storage modulus for CNT-NR composites whereas they are equal for pure NR in
both static and dynamic measurement due to so called ‘Payne effect’ at higher
dynamic strain amplitude. The difference between tensile modulus E(static) and
E
/
(dynamic) increases with filler concentration [99].
Figure 7 illustrates the DMA analysis of storage modulus and tan δ (loss tangent)
for NR-cellulose nanofiber composites at 1 Hz as a function of temperature
[102]. At low temperatures, the modulus is of nearly constant around 3 Â 10
9 Pa
due to the fact that molecular motions are largely restricted to vibration and shortrange rotational motions in the glassy state. Though the glassy modulus did not
improve with the addition of 5 wt% CNFs (2.1 GPa), but an improvement was
observed for 10 wt% CNF. Additionally, it can be seen that the relaxation of
polymer chains gets delayed in nanocomposites as compared to NR (tan δ curves).
The storage modulus for NR decreases to 1 MPa above the transition temperature
while there is substantial increase in modulus for composites in the similar temperature range as compared to NR. Moreover, there was a marked decrease in the
tan δ peak intensity along with broadening for composite with 10 wt% CNF
primarily due to restriction of chain mobility at the interface of matrix and
filler [102].
The variation in E
/
, E
// (loss modulus) and tan δ for coir fiber reinforced NR has
been shown in Fig. 8 [103]. The maxima in tan δ and E
// curves do not coincide in
the case of composites as observed for gum compound mainly due to the
Fig. 6 (a) Storage modulus and (b) tan δ vs. temperature for NR (open circle) and composites
with 1 ( filled triangle), 2.8 ( filled diamond), 5.4 ( filled circle) and 8.3 (open square) wt%
MWCNT. Inset of Figure b shows the maximum of tan δ with filler concentration exhibiting
linearly decreasing order [99]
26
K.K. Jana et al.
modulus (~1.82 GPa) for 1 wt% of filler in the glassy regime while the increment
levels off with further increase in the filler concentration. The composites exhibit a
huge increase in the storage modulus with filler (CNT) concentration above T g (the
modulus at T g + 70 K is 75 times higher than that of the pure matrix). Moreover, the
tensile modulus, as determined from tensile tests in linear region, is lower than the
storage modulus for CNT-NR composites whereas they are equal for pure NR in
both static and dynamic measurement due to so called ‘Payne effect’ at higher
dynamic strain amplitude. The difference between tensile modulus E(static) and
E
/
(dynamic) increases with filler concentration [99].
Figure 7 illustrates the DMA analysis of storage modulus and tan δ (loss tangent)
for NR-cellulose nanofiber composites at 1 Hz as a function of temperature
[102]. At low temperatures, the modulus is of nearly constant around 3 Â 10
9 Pa
due to the fact that molecular motions are largely restricted to vibration and shortrange rotational motions in the glassy state. Though the glassy modulus did not
improve with the addition of 5 wt% CNFs (2.1 GPa), but an improvement was
observed for 10 wt% CNF. Additionally, it can be seen that the relaxation of
polymer chains gets delayed in nanocomposites as compared to NR (tan δ curves).
The storage modulus for NR decreases to 1 MPa above the transition temperature
while there is substantial increase in modulus for composites in the similar temperature range as compared to NR. Moreover, there was a marked decrease in the
tan δ peak intensity along with broadening for composite with 10 wt% CNF
primarily due to restriction of chain mobility at the interface of matrix and
filler [102].
The variation in E
/
, E
// (loss modulus) and tan δ for coir fiber reinforced NR has
been shown in Fig. 8 [103]. The maxima in tan δ and E
// curves do not coincide in
the case of composites as observed for gum compound mainly due to the
Fig. 6 (a) Storage modulus and (b) tan δ vs. temperature for NR (open circle) and composites
with 1 ( filled triangle), 2.8 ( filled diamond), 5.4 ( filled circle) and 8.3 (open square) wt%
MWCNT. Inset of Figure b shows the maximum of tan δ with filler concentration exhibiting
linearly decreasing order [99]
26
K.K. Jana et al.