

cavity torsional rheometer. According to a well-established test protocol, two
samples were tested along frequency steps (0.1À17 Hz) repeated at several temperatures in the 60À160
C range. Each sample was tested using five frequency
steps, entangled so that by combining the results of both tests 10 applied frequencies in the 0.1À17 Hz were probed. Such a procedure lasts around 2 Â 30 min.
Using a VBA macroinstruction program both tests results, as recorded by the builtin system of the RPA, are loaded in an Excel worksheet. A data handling program,
written in MathCad
® 8.0 (MathSoft Inc., now PTC, Needham, MA, USA) then
extracts the shift factors for G
0 , G
00 and G* experimental data, calculates the
mastercurves at the selected reference temperature and returns all results to the
Excel worksheet. The whole data treatment lasts less than 10 seconds per sample.
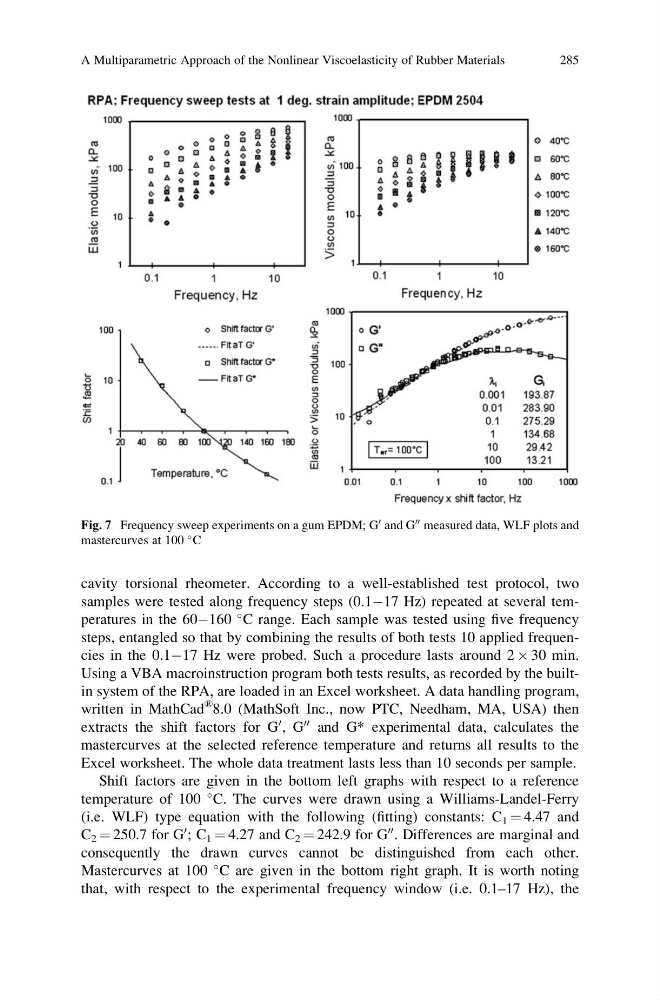
Shift factors are given in the bottom left graphs with respect to a reference
temperature of 100
C. The curves were drawn using a Williams-Landel-Ferry
(i.e. WLF) type equation with the following (fitting) constants: C 1 ¼ 4.47 and
C 2 ¼ 250.7 for G
0 ; C 1 ¼ 4.27 and C 2 ¼ 242.9 for G
00 . Differences are marginal and
consequently the drawn curves cannot be distinguished from each other.
Mastercurves at 100
C are given in the bottom right graph. It is worth noting
that, with respect to the experimental frequency window (i.e. 0.1–17 Hz), the
Fig. 7 Frequency sweep experiments on a gum EPDM; G
0 and G
00 measured data, WLF plots and
mastercurves at 100
C
A Multiparametric Approach of the Nonlinear Viscoelasticity of Rubber Materials
285
samples were tested along frequency steps (0.1À17 Hz) repeated at several temperatures in the 60À160
C range. Each sample was tested using five frequency
steps, entangled so that by combining the results of both tests 10 applied frequencies in the 0.1À17 Hz were probed. Such a procedure lasts around 2 Â 30 min.
Using a VBA macroinstruction program both tests results, as recorded by the builtin system of the RPA, are loaded in an Excel worksheet. A data handling program,
written in MathCad
® 8.0 (MathSoft Inc., now PTC, Needham, MA, USA) then
extracts the shift factors for G
0 , G
00 and G* experimental data, calculates the
mastercurves at the selected reference temperature and returns all results to the
Excel worksheet. The whole data treatment lasts less than 10 seconds per sample.
Shift factors are given in the bottom left graphs with respect to a reference
temperature of 100
C. The curves were drawn using a Williams-Landel-Ferry
(i.e. WLF) type equation with the following (fitting) constants: C 1 ¼ 4.47 and
C 2 ¼ 250.7 for G
0 ; C 1 ¼ 4.27 and C 2 ¼ 242.9 for G
00 . Differences are marginal and
consequently the drawn curves cannot be distinguished from each other.
Mastercurves at 100
C are given in the bottom right graph. It is worth noting
that, with respect to the experimental frequency window (i.e. 0.1–17 Hz), the
Fig. 7 Frequency sweep experiments on a gum EPDM; G
0 and G
00 measured data, WLF plots and
mastercurves at 100
C
A Multiparametric Approach of the Nonlinear Viscoelasticity of Rubber Materials
285