

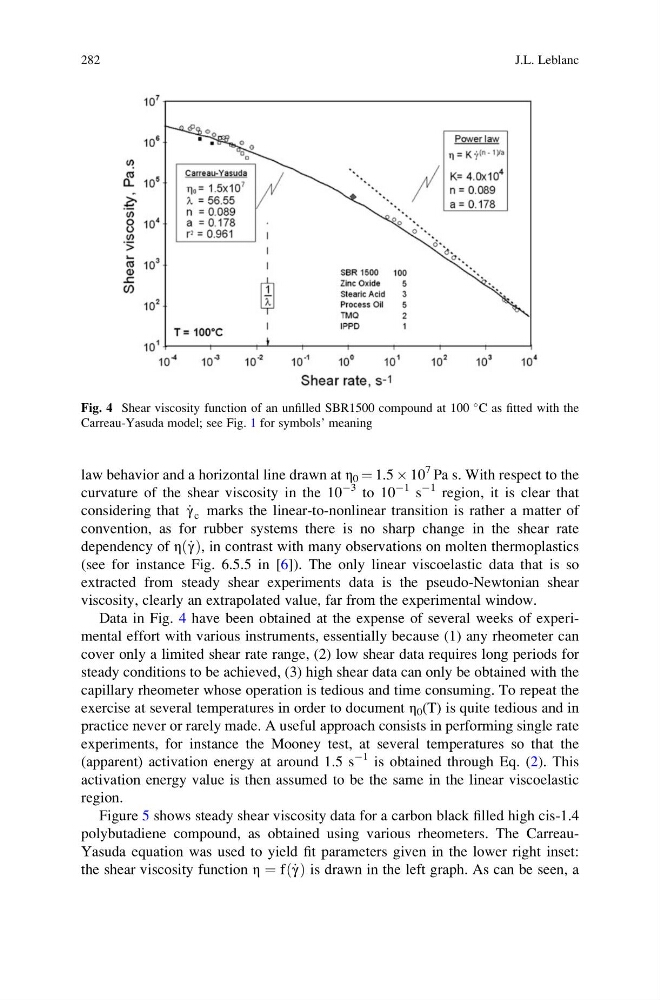
law behavior and a horizontal line drawn at η 0 ¼ 1.5 Â 10
7 Pa s. With respect to the
curvature of the shear viscosity in the 10
À3 to 10
À1 s
À1 region, it is clear that
considering that _
γ c marks the linear-to-nonlinear transition is rather a matter of
convention, as for rubber systems there is no sharp change in the shear rate
dependency of η _
γ
ð Þ, in contrast with many observations on molten thermoplastics
(see for instance Fig. 6.5.5 in [6]). The only linear viscoelastic data that is so
extracted from steady shear experiments data is the pseudo-Newtonian shear
viscosity, clearly an extrapolated value, far from the experimental window.
Data in Fig. 4 have been obtained at the expense of several weeks of experimental effort with various instruments, essentially because (1) any rheometer can
cover only a limited shear rate range, (2) low shear data requires long periods for
steady conditions to be achieved, (3) high shear data can only be obtained with the
capillary rheometer whose operation is tedious and time consuming. To repeat the
exercise at several temperatures in order to document η 0 (T) is quite tedious and in
practice never or rarely made. A useful approach consists in performing single rate
experiments, for instance the Mooney test, at several temperatures so that the
(apparent) activation energy at around 1.5 s
À1 is obtained through Eq. (2). This
activation energy value is then assumed to be the same in the linear viscoelastic
region.
Figure 5 shows steady shear viscosity data for a carbon black filled high cis-1.4
polybutadiene compound, as obtained using various rheometers. The CarreauYasuda equation was used to yield fit parameters given in the lower right inset:
the shear viscosity function η ¼ f _
γ
ð Þ is drawn in the left graph. As can be seen, a
Fig. 4 Shear viscosity function of an unfilled SBR1500 compound at 100
C as fitted with the
Carreau-Yasuda model; see Fig. 1 for symbols’ meaning
282
J.L. Leblanc
7 Pa s. With respect to the
curvature of the shear viscosity in the 10
À3 to 10
À1 s
À1 region, it is clear that
considering that _
γ c marks the linear-to-nonlinear transition is rather a matter of
convention, as for rubber systems there is no sharp change in the shear rate
dependency of η _
γ
ð Þ, in contrast with many observations on molten thermoplastics
(see for instance Fig. 6.5.5 in [6]). The only linear viscoelastic data that is so
extracted from steady shear experiments data is the pseudo-Newtonian shear
viscosity, clearly an extrapolated value, far from the experimental window.
Data in Fig. 4 have been obtained at the expense of several weeks of experimental effort with various instruments, essentially because (1) any rheometer can
cover only a limited shear rate range, (2) low shear data requires long periods for
steady conditions to be achieved, (3) high shear data can only be obtained with the
capillary rheometer whose operation is tedious and time consuming. To repeat the
exercise at several temperatures in order to document η 0 (T) is quite tedious and in
practice never or rarely made. A useful approach consists in performing single rate
experiments, for instance the Mooney test, at several temperatures so that the
(apparent) activation energy at around 1.5 s
À1 is obtained through Eq. (2). This
activation energy value is then assumed to be the same in the linear viscoelastic
region.
Figure 5 shows steady shear viscosity data for a carbon black filled high cis-1.4
polybutadiene compound, as obtained using various rheometers. The CarreauYasuda equation was used to yield fit parameters given in the lower right inset:
the shear viscosity function η ¼ f _
γ
ð Þ is drawn in the left graph. As can be seen, a
Fig. 4 Shear viscosity function of an unfilled SBR1500 compound at 100
C as fitted with the
Carreau-Yasuda model; see Fig. 1 for symbols’ meaning
282
J.L. Leblanc