

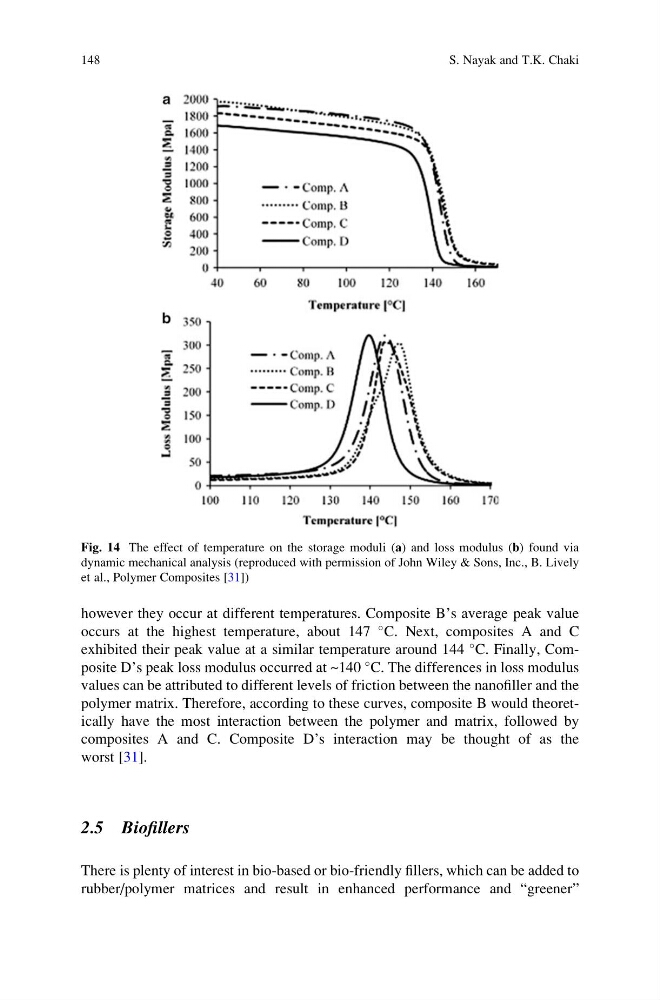
however they occur at different temperatures. Composite B’s average peak value
occurs at the highest temperature, about 147
C. Next, composites A and C
exhibited their peak value at a similar temperature around 144
C. Finally, Composite D’s peak loss modulus occurred at ~140
C. The differences in loss modulus
values can be attributed to different levels of friction between the nanofiller and the
polymer matrix. Therefore, according to these curves, composite B would theoretically have the most interaction between the polymer and matrix, followed by
composites A and C. Composite D’s interaction may be thought of as the
worst [31].
2.5 Biofillers
There is plenty of interest in bio-based or bio-friendly fillers, which can be added to
rubber/polymer matrices and result in enhanced performance and “greener”
Fig. 14 The effect of temperature on the storage moduli (a) and loss modulus (b) found via
dynamic mechanical analysis (reproduced with permission of John Wiley & Sons, Inc., B. Lively
et al., Polymer Composites [31])
148
S. Nayak and T.K. Chaki
occurs at the highest temperature, about 147
C. Next, composites A and C
exhibited their peak value at a similar temperature around 144
C. Finally, Composite D’s peak loss modulus occurred at ~140
C. The differences in loss modulus
values can be attributed to different levels of friction between the nanofiller and the
polymer matrix. Therefore, according to these curves, composite B would theoretically have the most interaction between the polymer and matrix, followed by
composites A and C. Composite D’s interaction may be thought of as the
worst [31].
2.5 Biofillers
There is plenty of interest in bio-based or bio-friendly fillers, which can be added to
rubber/polymer matrices and result in enhanced performance and “greener”
Fig. 14 The effect of temperature on the storage moduli (a) and loss modulus (b) found via
dynamic mechanical analysis (reproduced with permission of John Wiley & Sons, Inc., B. Lively
et al., Polymer Composites [31])
148
S. Nayak and T.K. Chaki