

46
M. L. de Barros Baltar et al.
Table 3 CO 2 emission (ton/km) per vehicle type used on responses
Vehicle type
Avg
Max
Min
Standard deviation
Heavy tow
1.377804
6.787573
0.331819
0.903166
Light tow
1.230352
8.069689
0.047608
0.892012
Motorcycle
1.263497
11.69225
0.171284
1.086791
Pickup
0.956686
10.74192
0.096552
0.881699
Super heavy tow
1.323073
7.747977
0.057445
1.047302
incidents that occurred during the peak hours of the road, at 8 am and at 5 pm. This
was not observed in the maximum value observed in incident that used the super
heavy tow truck on response, in this case, the highest emission is from an accident
with more than 4 h to clear. It is important to mentioning that the minimum emission
values were observed in incidents that occurred at dawn, when the traffic flow is
reduced.
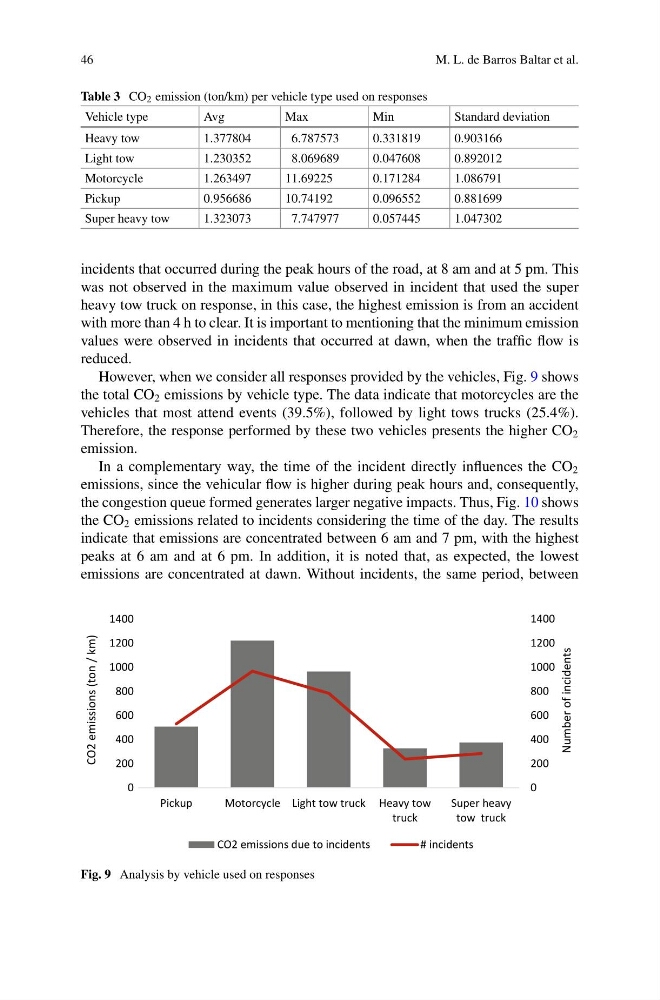
However, when we consider all responses provided by the vehicles, Fig. 9 shows
the total CO 2 emissions by vehicle type. The data indicate that motorcycles are the
vehicles that most attend events (39.5%), followed by light tows trucks (25.4%).
Therefore, the response performed by these two vehicles presents the higher CO 2
emission.
In a complementary way, the time of the incident directly influences the CO 2
emissions, since the vehicular flow is higher during peak hours and, consequently,
the congestion queue formed generates larger negative impacts. Thus, Fig. 10 shows
the CO 2 emissions related to incidents considering the time of the day. The results
indicate that emissions are concentrated between 6 am and 7 pm, with the highest
peaks at 6 am and at 6 pm. In addition, it is noted that, as expected, the lowest
emissions are concentrated at dawn. Without incidents, the same period, between
0
200
400
600
800
1000
1200
1400
0
200
400
600
800
1000
1200
1400
Pickup
Motorcycle Light tow truck Heavy tow
truck
Super heavy
tow truck
Number of incidents
CO2 emissions (ton / km)
CO2 emissions due to incidents
# incidents
Fig. 9 Analysis by vehicle used on responses
M. L. de Barros Baltar et al.
Table 3 CO 2 emission (ton/km) per vehicle type used on responses
Vehicle type
Avg
Max
Min
Standard deviation
Heavy tow
1.377804
6.787573
0.331819
0.903166
Light tow
1.230352
8.069689
0.047608
0.892012
Motorcycle
1.263497
11.69225
0.171284
1.086791
Pickup
0.956686
10.74192
0.096552
0.881699
Super heavy tow
1.323073
7.747977
0.057445
1.047302
incidents that occurred during the peak hours of the road, at 8 am and at 5 pm. This
was not observed in the maximum value observed in incident that used the super
heavy tow truck on response, in this case, the highest emission is from an accident
with more than 4 h to clear. It is important to mentioning that the minimum emission
values were observed in incidents that occurred at dawn, when the traffic flow is
reduced.
However, when we consider all responses provided by the vehicles, Fig. 9 shows
the total CO 2 emissions by vehicle type. The data indicate that motorcycles are the
vehicles that most attend events (39.5%), followed by light tows trucks (25.4%).
Therefore, the response performed by these two vehicles presents the higher CO 2
emission.
In a complementary way, the time of the incident directly influences the CO 2
emissions, since the vehicular flow is higher during peak hours and, consequently,
the congestion queue formed generates larger negative impacts. Thus, Fig. 10 shows
the CO 2 emissions related to incidents considering the time of the day. The results
indicate that emissions are concentrated between 6 am and 7 pm, with the highest
peaks at 6 am and at 6 pm. In addition, it is noted that, as expected, the lowest
emissions are concentrated at dawn. Without incidents, the same period, between
0
200
400
600
800
1000
1200
1400
0
200
400
600
800
1000
1200
1400
Pickup
Motorcycle Light tow truck Heavy tow
truck
Super heavy
tow truck
Number of incidents
CO2 emissions (ton / km)
CO2 emissions due to incidents
# incidents
Fig. 9 Analysis by vehicle used on responses