

Evaluating Impacts of Traffic Incidents on CO 2 Emissions in Express Roads
47
0
100
200
300
400
0
50
100
150
200
250
300
350
400
0 1 2 3 4 5 6 7 8 9 10 11 12 13 14 15 16 17 18 19 20 21 22 23
Number osf incidents
CO2
emissions (ton / km)
CO2 emissions due to incidents
Emisison of CO2 without incidents
# incidents
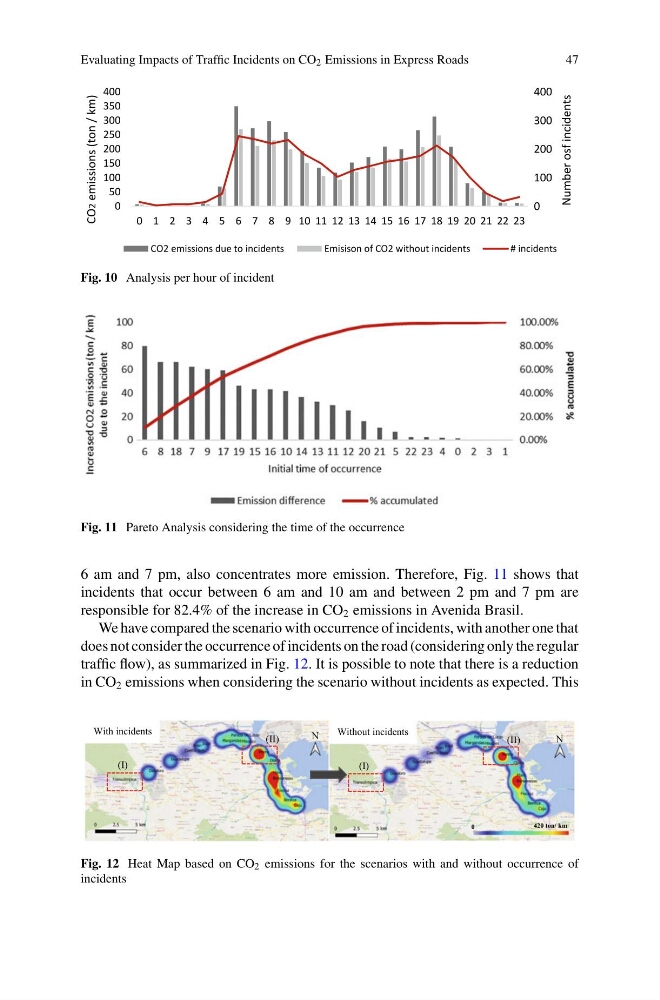
Fig. 10 Analysis per hour of incident
Fig. 11 Pareto Analysis considering the time of the occurrence
6 am and 7 pm, also concentrates more emission. Therefore, Fig. 11 shows that
incidents that occur between 6 am and 10 am and between 2 pm and 7 pm are
responsible for 82.4% of the increase in CO 2 emissions in Avenida Brasil.
We have compared the scenario with occurrence of incidents, with another one that
does not consider the occurrence of incidents on the road (considering only the regular
traffic flow), as summarized in Fig. 12. It is possible to note that there is a reduction
in CO 2 emissions when considering the scenario without incidents as expected. This
With incidents
Without incidents
0
420 ton/ km
(I)
(II)
(I)
(II)
N
N
Fig. 12 Heat Map based on CO 2 emissions for the scenarios with and without occurrence of
incidents
47
0
100
200
300
400
0
50
100
150
200
250
300
350
400
0 1 2 3 4 5 6 7 8 9 10 11 12 13 14 15 16 17 18 19 20 21 22 23
Number osf incidents
CO2
emissions (ton / km)
CO2 emissions due to incidents
Emisison of CO2 without incidents
# incidents
Fig. 10 Analysis per hour of incident
Fig. 11 Pareto Analysis considering the time of the occurrence
6 am and 7 pm, also concentrates more emission. Therefore, Fig. 11 shows that
incidents that occur between 6 am and 10 am and between 2 pm and 7 pm are
responsible for 82.4% of the increase in CO 2 emissions in Avenida Brasil.
We have compared the scenario with occurrence of incidents, with another one that
does not consider the occurrence of incidents on the road (considering only the regular
traffic flow), as summarized in Fig. 12. It is possible to note that there is a reduction
in CO 2 emissions when considering the scenario without incidents as expected. This
With incidents
Without incidents
0
420 ton/ km
(I)
(II)
(I)
(II)
N
N
Fig. 12 Heat Map based on CO 2 emissions for the scenarios with and without occurrence of
incidents