

Evaluating Impacts of Traffic Incidents on CO 2 Emissions in Express Roads
45
0
10
20
30
40
50
60
70
80
90
100
0
50
100
150
200
250
300
350
400
450
500
Broken-down
vehicle
Accident
Flat tire
Others
% accumulated
Increased CO2
emissions (ton / km)
due to the incident
Emission difference
% accumulated
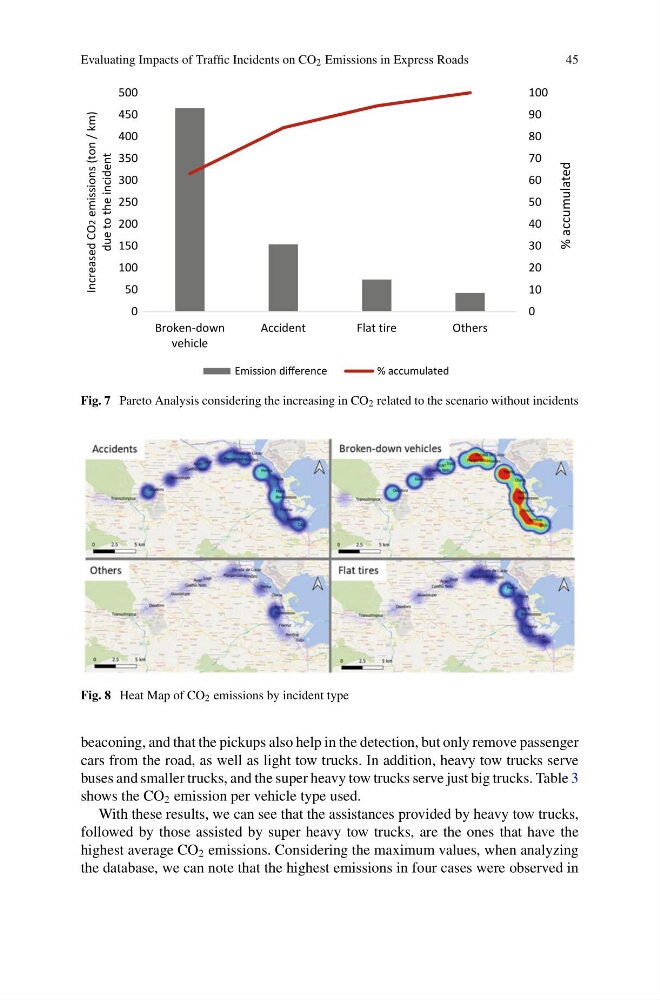
Fig. 7 Pareto Analysis considering the increasing in CO 2 related to the scenario without incidents
Fig. 8 Heat Map of CO 2 emissions by incident type
beaconing, and that the pickups also help in the detection, but only remove passenger
cars from the road, as well as light tow trucks. In addition, heavy tow trucks serve
buses and smaller trucks, and the super heavy tow trucks serve just big trucks. Table 3
shows the CO 2 emission per vehicle type used.
With these results, we can see that the assistances provided by heavy tow trucks,
followed by those assisted by super heavy tow trucks, are the ones that have the
highest average CO 2 emissions. Considering the maximum values, when analyzing
the database, we can note that the highest emissions in four cases were observed in
45
0
10
20
30
40
50
60
70
80
90
100
0
50
100
150
200
250
300
350
400
450
500
Broken-down
vehicle
Accident
Flat tire
Others
% accumulated
Increased CO2
emissions (ton / km)
due to the incident
Emission difference
% accumulated
Fig. 7 Pareto Analysis considering the increasing in CO 2 related to the scenario without incidents
Fig. 8 Heat Map of CO 2 emissions by incident type
beaconing, and that the pickups also help in the detection, but only remove passenger
cars from the road, as well as light tow trucks. In addition, heavy tow trucks serve
buses and smaller trucks, and the super heavy tow trucks serve just big trucks. Table 3
shows the CO 2 emission per vehicle type used.
With these results, we can see that the assistances provided by heavy tow trucks,
followed by those assisted by super heavy tow trucks, are the ones that have the
highest average CO 2 emissions. Considering the maximum values, when analyzing
the database, we can note that the highest emissions in four cases were observed in