

44
M. L. de Barros Baltar et al.
0
500
1000
1500
2000
2500
0
500
1000
1500
2000
2500
Accident
Broken-down
vehicles
Others
Flat tire
Number of incidents
CO2 emissions (ton / km)
CO2 emissions due to incidents
# incidents
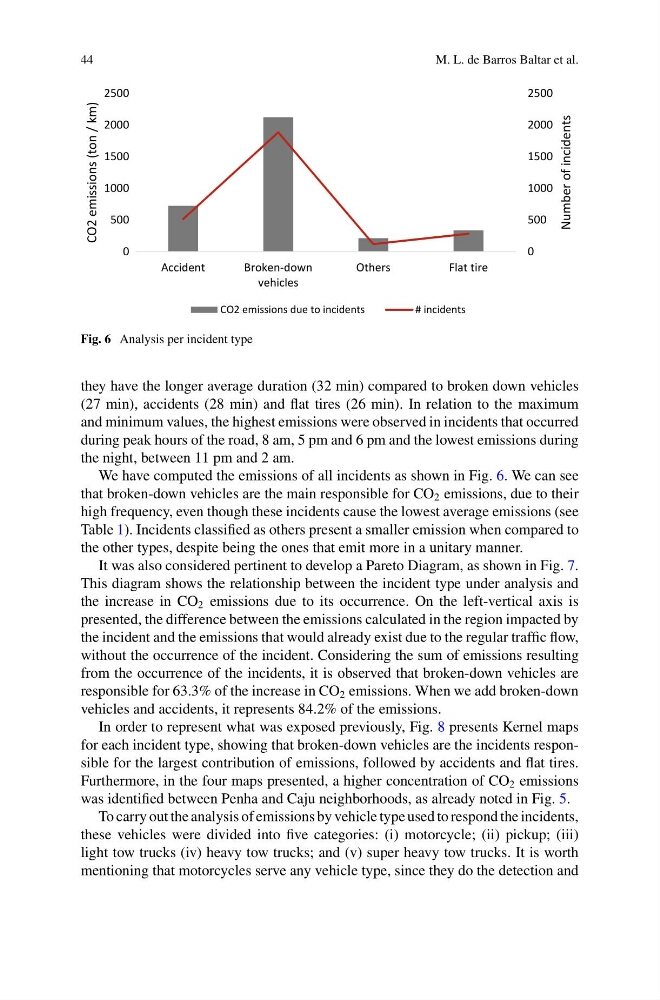
Fig. 6 Analysis per incident type
they have the longer average duration (32 min) compared to broken down vehicles
(27 min), accidents (28 min) and flat tires (26 min). In relation to the maximum
and minimum values, the highest emissions were observed in incidents that occurred
during peak hours of the road, 8 am, 5 pm and 6 pm and the lowest emissions during
the night, between 11 pm and 2 am.
We have computed the emissions of all incidents as shown in Fig. 6. We can see
that broken-down vehicles are the main responsible for CO 2 emissions, due to their
high frequency, even though these incidents cause the lowest average emissions (see
Table 1). Incidents classified as others present a smaller emission when compared to
the other types, despite being the ones that emit more in a unitary manner.
It was also considered pertinent to develop a Pareto Diagram, as shown in Fig. 7.
This diagram shows the relationship between the incident type under analysis and
the increase in CO 2 emissions due to its occurrence. On the left-vertical axis is
presented, the difference between the emissions calculated in the region impacted by
the incident and the emissions that would already exist due to the regular traffic flow,
without the occurrence of the incident. Considering the sum of emissions resulting
from the occurrence of the incidents, it is observed that broken-down vehicles are
responsible for 63.3% of the increase in CO 2 emissions. When we add broken-down
vehicles and accidents, it represents 84.2% of the emissions.
In order to represent what was exposed previously, Fig. 8 presents Kernel maps
for each incident type, showing that broken-down vehicles are the incidents responsible for the largest contribution of emissions, followed by accidents and flat tires.
Furthermore, in the four maps presented, a higher concentration of CO 2 emissions
was identified between Penha and Caju neighborhoods, as already noted in Fig. 5.
To carry out the analysis of emissions by vehicle type used to respond the incidents,
these vehicles were divided into five categories: (i) motorcycle; (ii) pickup; (iii)
light tow trucks (iv) heavy tow trucks; and (v) super heavy tow trucks. It is worth
mentioning that motorcycles serve any vehicle type, since they do the detection and
M. L. de Barros Baltar et al.
0
500
1000
1500
2000
2500
0
500
1000
1500
2000
2500
Accident
Broken-down
vehicles
Others
Flat tire
Number of incidents
CO2 emissions (ton / km)
CO2 emissions due to incidents
# incidents
Fig. 6 Analysis per incident type
they have the longer average duration (32 min) compared to broken down vehicles
(27 min), accidents (28 min) and flat tires (26 min). In relation to the maximum
and minimum values, the highest emissions were observed in incidents that occurred
during peak hours of the road, 8 am, 5 pm and 6 pm and the lowest emissions during
the night, between 11 pm and 2 am.
We have computed the emissions of all incidents as shown in Fig. 6. We can see
that broken-down vehicles are the main responsible for CO 2 emissions, due to their
high frequency, even though these incidents cause the lowest average emissions (see
Table 1). Incidents classified as others present a smaller emission when compared to
the other types, despite being the ones that emit more in a unitary manner.
It was also considered pertinent to develop a Pareto Diagram, as shown in Fig. 7.
This diagram shows the relationship between the incident type under analysis and
the increase in CO 2 emissions due to its occurrence. On the left-vertical axis is
presented, the difference between the emissions calculated in the region impacted by
the incident and the emissions that would already exist due to the regular traffic flow,
without the occurrence of the incident. Considering the sum of emissions resulting
from the occurrence of the incidents, it is observed that broken-down vehicles are
responsible for 63.3% of the increase in CO 2 emissions. When we add broken-down
vehicles and accidents, it represents 84.2% of the emissions.
In order to represent what was exposed previously, Fig. 8 presents Kernel maps
for each incident type, showing that broken-down vehicles are the incidents responsible for the largest contribution of emissions, followed by accidents and flat tires.
Furthermore, in the four maps presented, a higher concentration of CO 2 emissions
was identified between Penha and Caju neighborhoods, as already noted in Fig. 5.
To carry out the analysis of emissions by vehicle type used to respond the incidents,
these vehicles were divided into five categories: (i) motorcycle; (ii) pickup; (iii)
light tow trucks (iv) heavy tow trucks; and (v) super heavy tow trucks. It is worth
mentioning that motorcycles serve any vehicle type, since they do the detection and