

Evaluating Impacts of Traffic Incidents on CO 2 Emissions in Express Roads
43
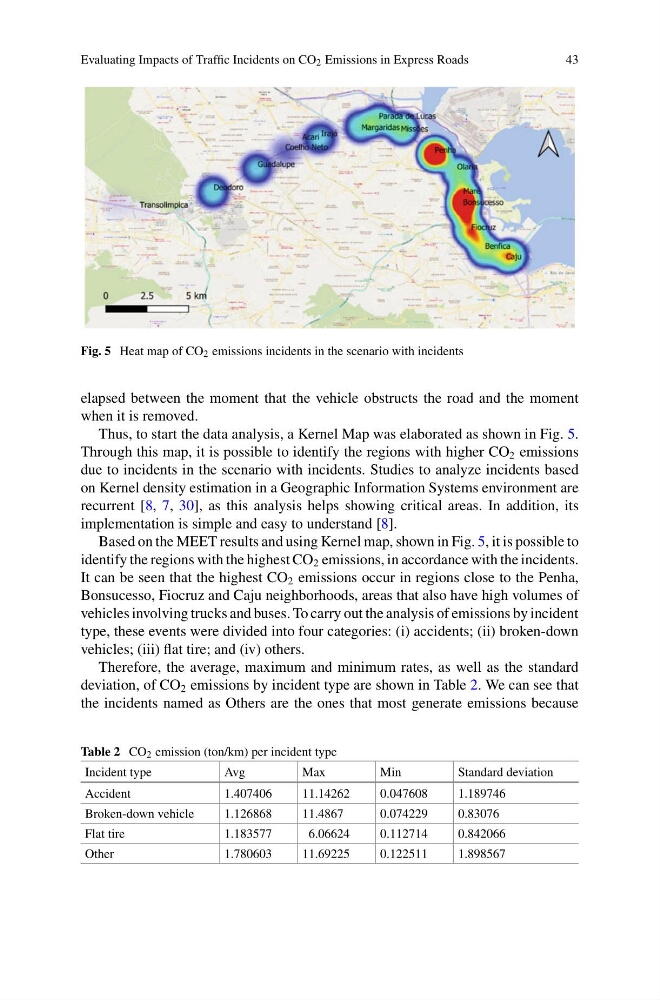
Fig. 5 Heat map of CO 2 emissions incidents in the scenario with incidents
elapsed between the moment that the vehicle obstructs the road and the moment
when it is removed.
Thus, to start the data analysis, a Kernel Map was elaborated as shown in Fig. 5.
Through this map, it is possible to identify the regions with higher CO 2 emissions
due to incidents in the scenario with incidents. Studies to analyze incidents based
on Kernel density estimation in a Geographic Information Systems environment are
recurrent [8, 7, 30], as this analysis helps showing critical areas. In addition, its
implementation is simple and easy to understand [8].
Based on the MEET results and using Kernel map, shown in Fig. 5, it is possible to
identify the regions with the highest CO 2 emissions, in accordance with the incidents.
It can be seen that the highest CO 2 emissions occur in regions close to the Penha,
Bonsucesso, Fiocruz and Caju neighborhoods, areas that also have high volumes of
vehicles involving trucks and buses. To carry out the analysis of emissions by incident
type, these events were divided into four categories: (i) accidents; (ii) broken-down
vehicles; (iii) flat tire; and (iv) others.
Therefore, the average, maximum and minimum rates, as well as the standard
deviation, of CO 2 emissions by incident type are shown in Table 2. We can see that
the incidents named as Others are the ones that most generate emissions because
Table 2 CO 2 emission (ton/km) per incident type
Incident type
Avg
Max
Min
Standard deviation
Accident
1.407406
11.14262
0.047608
1.189746
Broken-down vehicle
1.126868
11.4867
0.074229
0.83076
Flat tire
1.183577
6.06624
0.112714
0.842066
Other
1.780603
11.69225
0.122511
1.898567
43
Fig. 5 Heat map of CO 2 emissions incidents in the scenario with incidents
elapsed between the moment that the vehicle obstructs the road and the moment
when it is removed.
Thus, to start the data analysis, a Kernel Map was elaborated as shown in Fig. 5.
Through this map, it is possible to identify the regions with higher CO 2 emissions
due to incidents in the scenario with incidents. Studies to analyze incidents based
on Kernel density estimation in a Geographic Information Systems environment are
recurrent [8, 7, 30], as this analysis helps showing critical areas. In addition, its
implementation is simple and easy to understand [8].
Based on the MEET results and using Kernel map, shown in Fig. 5, it is possible to
identify the regions with the highest CO 2 emissions, in accordance with the incidents.
It can be seen that the highest CO 2 emissions occur in regions close to the Penha,
Bonsucesso, Fiocruz and Caju neighborhoods, areas that also have high volumes of
vehicles involving trucks and buses. To carry out the analysis of emissions by incident
type, these events were divided into four categories: (i) accidents; (ii) broken-down
vehicles; (iii) flat tire; and (iv) others.
Therefore, the average, maximum and minimum rates, as well as the standard
deviation, of CO 2 emissions by incident type are shown in Table 2. We can see that
the incidents named as Others are the ones that most generate emissions because
Table 2 CO 2 emission (ton/km) per incident type
Incident type
Avg
Max
Min
Standard deviation
Accident
1.407406
11.14262
0.047608
1.189746
Broken-down vehicle
1.126868
11.4867
0.074229
0.83076
Flat tire
1.183577
6.06624
0.112714
0.842066
Other
1.780603
11.69225
0.122511
1.898567