

42
M. L. de Barros Baltar et al.
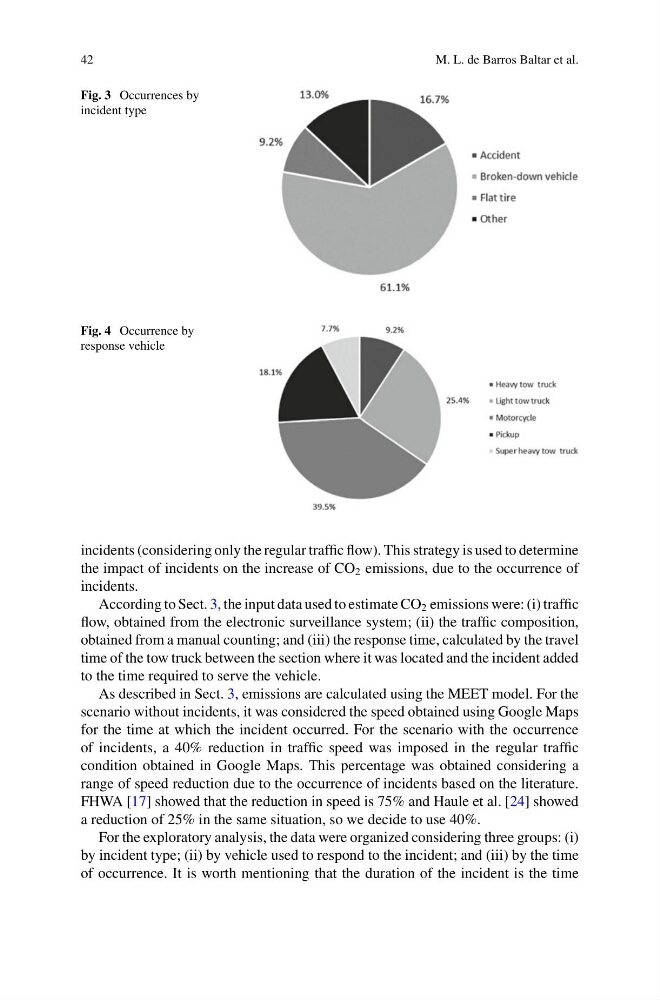
Fig. 3 Occurrences by
incident type
Fig. 4 Occurrence by
response vehicle
incidents (considering only the regular traffic flow). This strategy is used to determine
the impact of incidents on the increase of CO 2 emissions, due to the occurrence of
incidents.
According to Sect. 3, the input data used to estimate CO 2 emissions were: (i) traffic
flow, obtained from the electronic surveillance system; (ii) the traffic composition,
obtained from a manual counting; and (iii) the response time, calculated by the travel
time of the tow truck between the section where it was located and the incident added
to the time required to serve the vehicle.
As described in Sect. 3, emissions are calculated using the MEET model. For the
scenario without incidents, it was considered the speed obtained using Google Maps
for the time at which the incident occurred. For the scenario with the occurrence
of incidents, a 40% reduction in traffic speed was imposed in the regular traffic
condition obtained in Google Maps. This percentage was obtained considering a
range of speed reduction due to the occurrence of incidents based on the literature.
FHWA [17] showed that the reduction in speed is 75% and Haule et al. [24] showed
a reduction of 25% in the same situation, so we decide to use 40%.
For the exploratory analysis, the data were organized considering three groups: (i)
by incident type; (ii) by vehicle used to respond to the incident; and (iii) by the time
of occurrence. It is worth mentioning that the duration of the incident is the time
M. L. de Barros Baltar et al.
Fig. 3 Occurrences by
incident type
Fig. 4 Occurrence by
response vehicle
incidents (considering only the regular traffic flow). This strategy is used to determine
the impact of incidents on the increase of CO 2 emissions, due to the occurrence of
incidents.
According to Sect. 3, the input data used to estimate CO 2 emissions were: (i) traffic
flow, obtained from the electronic surveillance system; (ii) the traffic composition,
obtained from a manual counting; and (iii) the response time, calculated by the travel
time of the tow truck between the section where it was located and the incident added
to the time required to serve the vehicle.
As described in Sect. 3, emissions are calculated using the MEET model. For the
scenario without incidents, it was considered the speed obtained using Google Maps
for the time at which the incident occurred. For the scenario with the occurrence
of incidents, a 40% reduction in traffic speed was imposed in the regular traffic
condition obtained in Google Maps. This percentage was obtained considering a
range of speed reduction due to the occurrence of incidents based on the literature.
FHWA [17] showed that the reduction in speed is 75% and Haule et al. [24] showed
a reduction of 25% in the same situation, so we decide to use 40%.
For the exploratory analysis, the data were organized considering three groups: (i)
by incident type; (ii) by vehicle used to respond to the incident; and (iii) by the time
of occurrence. It is worth mentioning that the duration of the incident is the time