

102
D. Chakraborty
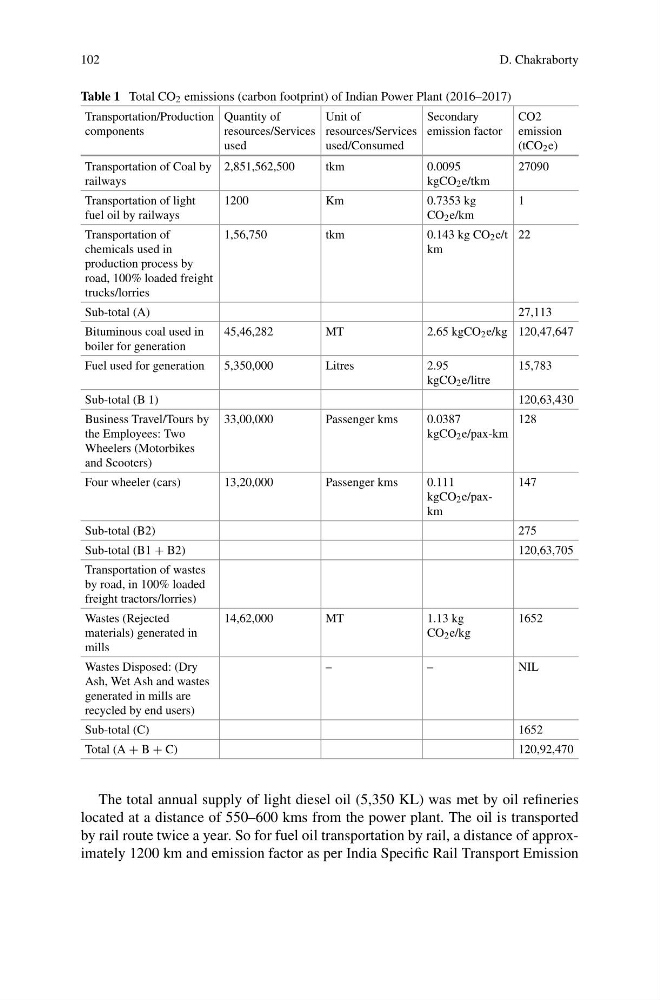
Table 1 Total CO 2 emissions (carbon footprint) of Indian Power Plant (2016–2017)
Transportation/Production
components
Quantity of
resources/Services
used
Unit of
resources/Services
used/Consumed
Secondary
emission factor
CO2
emission
(tCO 2 e)
Transportation of Coal by
railways
2,851,562,500
tkm
0.0095
kgCO 2 e/tkm
27090
Transportation of light
fuel oil by railways
1200
Km
0.7353 kg
CO 2 e/km
1
Transportation of
chemicals used in
production process by
road, 100% loaded freight
trucks/lorries
1,56,750
tkm
0.143 kg CO 2 e/t
km
22
Sub-total (A)
27,113
Bituminous coal used in
boiler for generation
45,46,282
MT
2.65 kgCO 2 e/kg 120,47,647
Fuel used for generation
5,350,000
Litres
2.95
kgCO 2 e/litre
15,783
Sub-total (B 1)
120,63,430
Business Travel/Tours by
the Employees: Two
Wheelers (Motorbikes
and Scooters)
33,00,000
Passenger kms
0.0387
kgCO 2 e/pax-km
128
Four wheeler (cars)
13,20,000
Passenger kms
0.111
kgCO 2 e/paxkm
147
Sub-total (B2)
275
Sub-total (B1 + B2)
120,63,705
Transportation of wastes
by road, in 100% loaded
freight tractors/lorries)
Wastes (Rejected
materials) generated in
mills
14,62,000
MT
1.13 kg
CO 2 e/kg
1652
Wastes Disposed: (Dry
Ash, Wet Ash and wastes
generated in mills are
recycled by end users)
–
–
NIL
Sub-total (C)
1652
Total (A + B + C)
120,92,470
The total annual supply of light diesel oil (5,350 KL) was met by oil refineries
located at a distance of 550–600 kms from the power plant. The oil is transported
by rail route twice a year. So for fuel oil transportation by rail, a distance of approximately 1200 km and emission factor as per India Specific Rail Transport Emission
D. Chakraborty
Table 1 Total CO 2 emissions (carbon footprint) of Indian Power Plant (2016–2017)
Transportation/Production
components
Quantity of
resources/Services
used
Unit of
resources/Services
used/Consumed
Secondary
emission factor
CO2
emission
(tCO 2 e)
Transportation of Coal by
railways
2,851,562,500
tkm
0.0095
kgCO 2 e/tkm
27090
Transportation of light
fuel oil by railways
1200
Km
0.7353 kg
CO 2 e/km
1
Transportation of
chemicals used in
production process by
road, 100% loaded freight
trucks/lorries
1,56,750
tkm
0.143 kg CO 2 e/t
km
22
Sub-total (A)
27,113
Bituminous coal used in
boiler for generation
45,46,282
MT
2.65 kgCO 2 e/kg 120,47,647
Fuel used for generation
5,350,000
Litres
2.95
kgCO 2 e/litre
15,783
Sub-total (B 1)
120,63,430
Business Travel/Tours by
the Employees: Two
Wheelers (Motorbikes
and Scooters)
33,00,000
Passenger kms
0.0387
kgCO 2 e/pax-km
128
Four wheeler (cars)
13,20,000
Passenger kms
0.111
kgCO 2 e/paxkm
147
Sub-total (B2)
275
Sub-total (B1 + B2)
120,63,705
Transportation of wastes
by road, in 100% loaded
freight tractors/lorries)
Wastes (Rejected
materials) generated in
mills
14,62,000
MT
1.13 kg
CO 2 e/kg
1652
Wastes Disposed: (Dry
Ash, Wet Ash and wastes
generated in mills are
recycled by end users)
–
–
NIL
Sub-total (C)
1652
Total (A + B + C)
120,92,470
The total annual supply of light diesel oil (5,350 KL) was met by oil refineries
located at a distance of 550–600 kms from the power plant. The oil is transported
by rail route twice a year. So for fuel oil transportation by rail, a distance of approximately 1200 km and emission factor as per India Specific Rail Transport Emission