

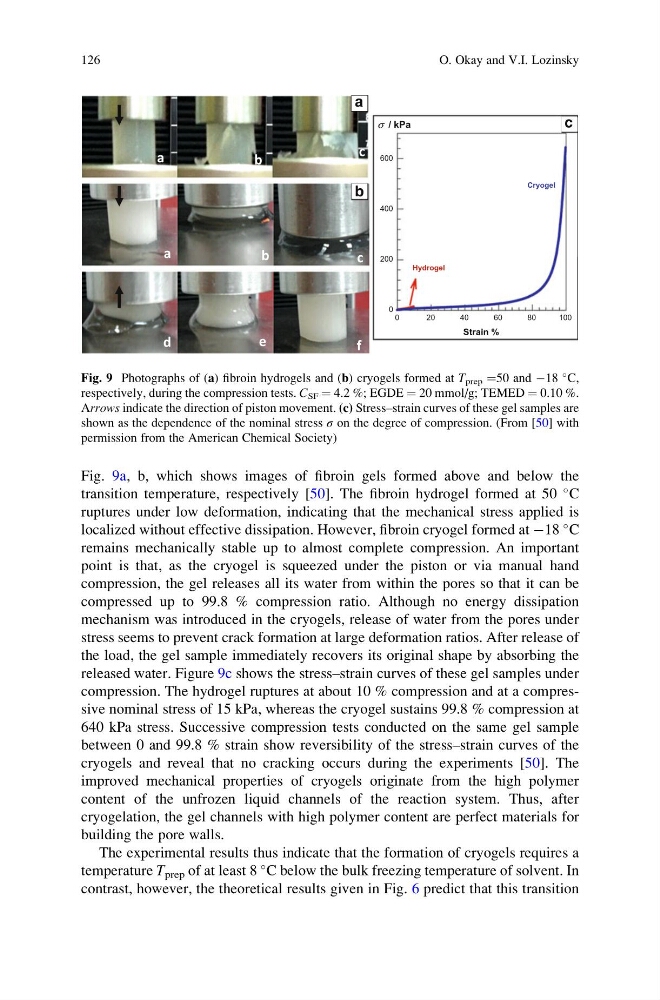
Fig. 9a, b, which shows images of fibroin gels formed above and below the
transition temperature, respectively [50]. The fibroin hydrogel formed at 50
C
ruptures under low deformation, indicating that the mechanical stress applied is
localized without effective dissipation. However, fibroin cryogel formed at À18
C
remains mechanically stable up to almost complete compression. An important
point is that, as the cryogel is squeezed under the piston or via manual hand
compression, the gel releases all its water from within the pores so that it can be
compressed up to 99.8 % compression ratio. Although no energy dissipation
mechanism was introduced in the cryogels, release of water from the pores under
stress seems to prevent crack formation at large deformation ratios. After release of
the load, the gel sample immediately recovers its original shape by absorbing the
released water. Figure 9c shows the stress–strain curves of these gel samples under
compression. The hydrogel ruptures at about 10 % compression and at a compressive nominal stress of 15 kPa, whereas the cryogel sustains 99.8 % compression at
640 kPa stress. Successive compression tests conducted on the same gel sample
between 0 and 99.8 % strain show reversibility of the stress–strain curves of the
cryogels and reveal that no cracking occurs during the experiments [50]. The
improved mechanical properties of cryogels originate from the high polymer
content of the unfrozen liquid channels of the reaction system. Thus, after
cryogelation, the gel channels with high polymer content are perfect materials for
building the pore walls.
The experimental results thus indicate that the formation of cryogels requires a
temperature T prep of at least 8
C below the bulk freezing temperature of solvent. In
contrast, however, the theoretical results given in Fig. 6 predict that this transition
c
d
e
f
Strain %
0
2 0
4 0
6 0
8 0
1 0 0
σ / kPa
0
200
400
600
Hydrogel
Cryogel
a
b
c
a
b
a
b
c
Fig. 9 Photographs of (a) fibroin hydrogels and (b) cryogels formed at T prep ¼50 and À18
C,
respectively, during the compression tests. C SF ¼ 4.2 %; EGDE ¼ 20 mmol/g; TEMED ¼ 0.10 %.
Arrows indicate the direction of piston movement. (c) Stress–strain curves of these gel samples are
shown as the dependence of the nominal stress σ on the degree of compression. (From [50] with
permission from the American Chemical Society)
126
O. Okay and V.I. Lozinsky
transition temperature, respectively [50]. The fibroin hydrogel formed at 50
C
ruptures under low deformation, indicating that the mechanical stress applied is
localized without effective dissipation. However, fibroin cryogel formed at À18
C
remains mechanically stable up to almost complete compression. An important
point is that, as the cryogel is squeezed under the piston or via manual hand
compression, the gel releases all its water from within the pores so that it can be
compressed up to 99.8 % compression ratio. Although no energy dissipation
mechanism was introduced in the cryogels, release of water from the pores under
stress seems to prevent crack formation at large deformation ratios. After release of
the load, the gel sample immediately recovers its original shape by absorbing the
released water. Figure 9c shows the stress–strain curves of these gel samples under
compression. The hydrogel ruptures at about 10 % compression and at a compressive nominal stress of 15 kPa, whereas the cryogel sustains 99.8 % compression at
640 kPa stress. Successive compression tests conducted on the same gel sample
between 0 and 99.8 % strain show reversibility of the stress–strain curves of the
cryogels and reveal that no cracking occurs during the experiments [50]. The
improved mechanical properties of cryogels originate from the high polymer
content of the unfrozen liquid channels of the reaction system. Thus, after
cryogelation, the gel channels with high polymer content are perfect materials for
building the pore walls.
The experimental results thus indicate that the formation of cryogels requires a
temperature T prep of at least 8
C below the bulk freezing temperature of solvent. In
contrast, however, the theoretical results given in Fig. 6 predict that this transition
c
d
e
f
Strain %
0
2 0
4 0
6 0
8 0
1 0 0
σ / kPa
0
200
400
600
Hydrogel
Cryogel
a
b
c
a
b
a
b
c
Fig. 9 Photographs of (a) fibroin hydrogels and (b) cryogels formed at T prep ¼50 and À18
C,
respectively, during the compression tests. C SF ¼ 4.2 %; EGDE ¼ 20 mmol/g; TEMED ¼ 0.10 %.
Arrows indicate the direction of piston movement. (c) Stress–strain curves of these gel samples are
shown as the dependence of the nominal stress σ on the degree of compression. (From [50] with
permission from the American Chemical Society)
126
O. Okay and V.I. Lozinsky