

3.1.4 P3HT Nanowires
The dedoping effects of NaOH treatment on electrochemically synthesized P3HT
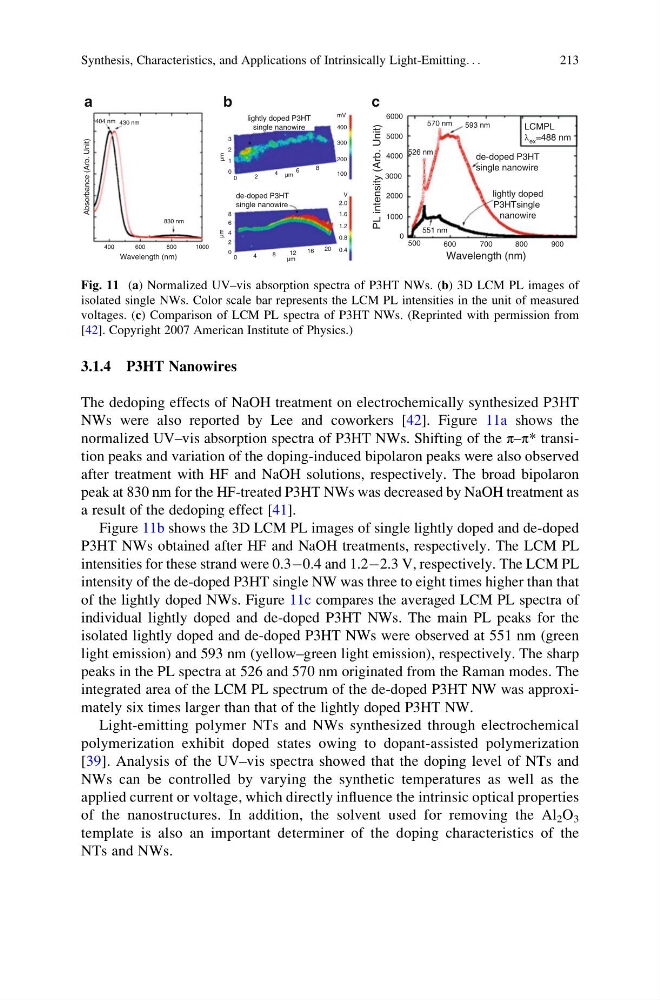
NWs were also reported by Lee and coworkers [42]. Figure 11a shows the
normalized UV–vis absorption spectra of P3HT NWs. Shifting of the π–π* transition peaks and variation of the doping-induced bipolaron peaks were also observed
after treatment with HF and NaOH solutions, respectively. The broad bipolaron
peak at 830 nm for the HF-treated P3HT NWs was decreased by NaOH treatment as
a result of the dedoping effect [41].
Figure 11b shows the 3D LCM PL images of single lightly doped and de-doped
P3HT NWs obtained after HF and NaOH treatments, respectively. The LCM PL
intensities for these strand were 0.3À0.4 and 1.2À2.3 V, respectively. The LCM PL
intensity of the de-doped P3HT single NW was three to eight times higher than that
of the lightly doped NWs. Figure 11c compares the averaged LCM PL spectra of
individual lightly doped and de-doped P3HT NWs. The main PL peaks for the
isolated lightly doped and de-doped P3HT NWs were observed at 551 nm (green
light emission) and 593 nm (yellow–green light emission), respectively. The sharp
peaks in the PL spectra at 526 and 570 nm originated from the Raman modes. The
integrated area of the LCM PL spectrum of the de-doped P3HT NW was approximately six times larger than that of the lightly doped P3HT NW.
Light-emitting polymer NTs and NWs synthesized through electrochemical
polymerization exhibit doped states owing to dopant-assisted polymerization
[39]. Analysis of the UV–vis spectra showed that the doping level of NTs and
NWs can be controlled by varying the synthetic temperatures as well as the
applied current or voltage, which directly influence the intrinsic optical properties
of the nanostructures. In addition, the solvent used for removing the Al 2 O 3
template is also an important determiner of the doping characteristics of the
NTs and NWs.
3
1
µm
µm
µm
µm
8
lightly doped P3HT
single nanowire
de-doped P3HT
single nanowire
8
6
4
2
0
20
500
PL intensity (Arb. Unit)
0
1000
2000
3000
4000
5000
6000
526 nm
593 nm
570 nm
551 nm
900
LCMPL
λ ex =488 nm
800
lightly doped
P3HTsingle
nanowire
de-doped P3HT
single nanowire
Wavelength (nm)
700
600
16
12
8
4
0
Wavelength (nm)
1000
800
600
Absorbance (Arb. Unit)
404 nm 430 nm
830 nm
400
0.4
0.8
1.2
1.6
2.0
V
100
200
300
400
mV
6
4
2
0
0
2
a
c
b
Fig. 11 (a) Normalized UV–vis absorption spectra of P3HT NWs. (b) 3D LCM PL images of
isolated single NWs. Color scale bar represents the LCM PL intensities in the unit of measured
voltages. (c) Comparison of LCM PL spectra of P3HT NWs. (Reprinted with permission from
[42]. Copyright 2007 American Institute of Physics.)
Synthesis, Characteristics, and Applications of Intrinsically Light-Emitting. . .
213
The dedoping effects of NaOH treatment on electrochemically synthesized P3HT
NWs were also reported by Lee and coworkers [42]. Figure 11a shows the
normalized UV–vis absorption spectra of P3HT NWs. Shifting of the π–π* transition peaks and variation of the doping-induced bipolaron peaks were also observed
after treatment with HF and NaOH solutions, respectively. The broad bipolaron
peak at 830 nm for the HF-treated P3HT NWs was decreased by NaOH treatment as
a result of the dedoping effect [41].
Figure 11b shows the 3D LCM PL images of single lightly doped and de-doped
P3HT NWs obtained after HF and NaOH treatments, respectively. The LCM PL
intensities for these strand were 0.3À0.4 and 1.2À2.3 V, respectively. The LCM PL
intensity of the de-doped P3HT single NW was three to eight times higher than that
of the lightly doped NWs. Figure 11c compares the averaged LCM PL spectra of
individual lightly doped and de-doped P3HT NWs. The main PL peaks for the
isolated lightly doped and de-doped P3HT NWs were observed at 551 nm (green
light emission) and 593 nm (yellow–green light emission), respectively. The sharp
peaks in the PL spectra at 526 and 570 nm originated from the Raman modes. The
integrated area of the LCM PL spectrum of the de-doped P3HT NW was approximately six times larger than that of the lightly doped P3HT NW.
Light-emitting polymer NTs and NWs synthesized through electrochemical
polymerization exhibit doped states owing to dopant-assisted polymerization
[39]. Analysis of the UV–vis spectra showed that the doping level of NTs and
NWs can be controlled by varying the synthetic temperatures as well as the
applied current or voltage, which directly influence the intrinsic optical properties
of the nanostructures. In addition, the solvent used for removing the Al 2 O 3
template is also an important determiner of the doping characteristics of the
NTs and NWs.
3
1
µm
µm
µm
µm
8
lightly doped P3HT
single nanowire
de-doped P3HT
single nanowire
8
6
4
2
0
20
500
PL intensity (Arb. Unit)
0
1000
2000
3000
4000
5000
6000
526 nm
593 nm
570 nm
551 nm
900
LCMPL
λ ex =488 nm
800
lightly doped
P3HTsingle
nanowire
de-doped P3HT
single nanowire
Wavelength (nm)
700
600
16
12
8
4
0
Wavelength (nm)
1000
800
600
Absorbance (Arb. Unit)
404 nm 430 nm
830 nm
400
0.4
0.8
1.2
1.6
2.0
V
100
200
300
400
mV
6
4
2
0
0
2
a
c
b
Fig. 11 (a) Normalized UV–vis absorption spectra of P3HT NWs. (b) 3D LCM PL images of
isolated single NWs. Color scale bar represents the LCM PL intensities in the unit of measured
voltages. (c) Comparison of LCM PL spectra of P3HT NWs. (Reprinted with permission from
[42]. Copyright 2007 American Institute of Physics.)
Synthesis, Characteristics, and Applications of Intrinsically Light-Emitting. . .
213