

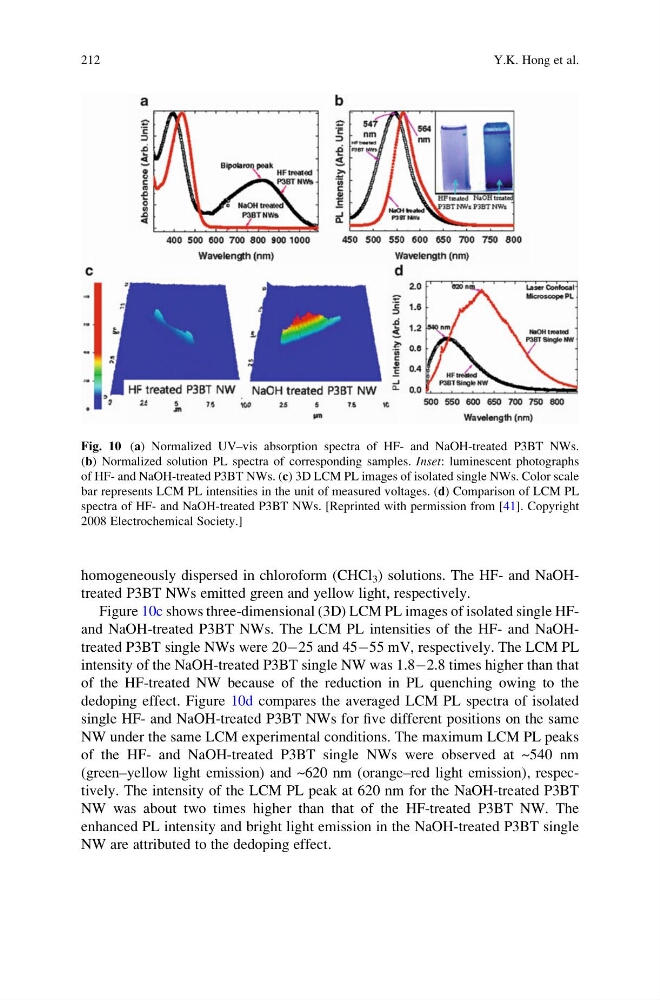
homogeneously dispersed in chloroform (CHCl 3 ) solutions. The HF- and NaOHtreated P3BT NWs emitted green and yellow light, respectively.
Figure 10c shows three-dimensional (3D) LCM PL images of isolated single HFand NaOH-treated P3BT NWs. The LCM PL intensities of the HF- and NaOHtreated P3BT single NWs were 20À25 and 45À55 mV, respectively. The LCM PL
intensity of the NaOH-treated P3BT single NW was 1.8À2.8 times higher than that
of the HF-treated NW because of the reduction in PL quenching owing to the
dedoping effect. Figure 10d compares the averaged LCM PL spectra of isolated
single HF- and NaOH-treated P3BT NWs for five different positions on the same
NW under the same LCM experimental conditions. The maximum LCM PL peaks
of the HF- and NaOH-treated P3BT single NWs were observed at ~540 nm
(green–yellow light emission) and ~620 nm (orange–red light emission), respectively. The intensity of the LCM PL peak at 620 nm for the NaOH-treated P3BT
NW was about two times higher than that of the HF-treated P3BT NW. The
enhanced PL intensity and bright light emission in the NaOH-treated P3BT single
NW are attributed to the dedoping effect.
Fig. 10 (a) Normalized UV–vis absorption spectra of HF- and NaOH-treated P3BT NWs.
(b) Normalized solution PL spectra of corresponding samples. Inset: luminescent photographs
of HF- and NaOH-treated P3BT NWs. (c) 3D LCM PL images of isolated single NWs. Color scale
bar represents LCM PL intensities in the unit of measured voltages. (d) Comparison of LCM PL
spectra of HF- and NaOH-treated P3BT NWs. [Reprinted with permission from [41]. Copyright
2008 Electrochemical Society.]
212
Y.K. Hong et al.
Figure 10c shows three-dimensional (3D) LCM PL images of isolated single HFand NaOH-treated P3BT NWs. The LCM PL intensities of the HF- and NaOHtreated P3BT single NWs were 20À25 and 45À55 mV, respectively. The LCM PL
intensity of the NaOH-treated P3BT single NW was 1.8À2.8 times higher than that
of the HF-treated NW because of the reduction in PL quenching owing to the
dedoping effect. Figure 10d compares the averaged LCM PL spectra of isolated
single HF- and NaOH-treated P3BT NWs for five different positions on the same
NW under the same LCM experimental conditions. The maximum LCM PL peaks
of the HF- and NaOH-treated P3BT single NWs were observed at ~540 nm
(green–yellow light emission) and ~620 nm (orange–red light emission), respectively. The intensity of the LCM PL peak at 620 nm for the NaOH-treated P3BT
NW was about two times higher than that of the HF-treated P3BT NW. The
enhanced PL intensity and bright light emission in the NaOH-treated P3BT single
NW are attributed to the dedoping effect.
Fig. 10 (a) Normalized UV–vis absorption spectra of HF- and NaOH-treated P3BT NWs.
(b) Normalized solution PL spectra of corresponding samples. Inset: luminescent photographs
of HF- and NaOH-treated P3BT NWs. (c) 3D LCM PL images of isolated single NWs. Color scale
bar represents LCM PL intensities in the unit of measured voltages. (d) Comparison of LCM PL
spectra of HF- and NaOH-treated P3BT NWs. [Reprinted with permission from [41]. Copyright
2008 Electrochemical Society.]
212
Y.K. Hong et al.