

for the helix–coil transition, in which the acid effect has been taken into account.
Second, the solvent–polymer interaction parameter (χ) was considered to be negative in the whole temperature range and was regarded as an inverse measure of
temperature.
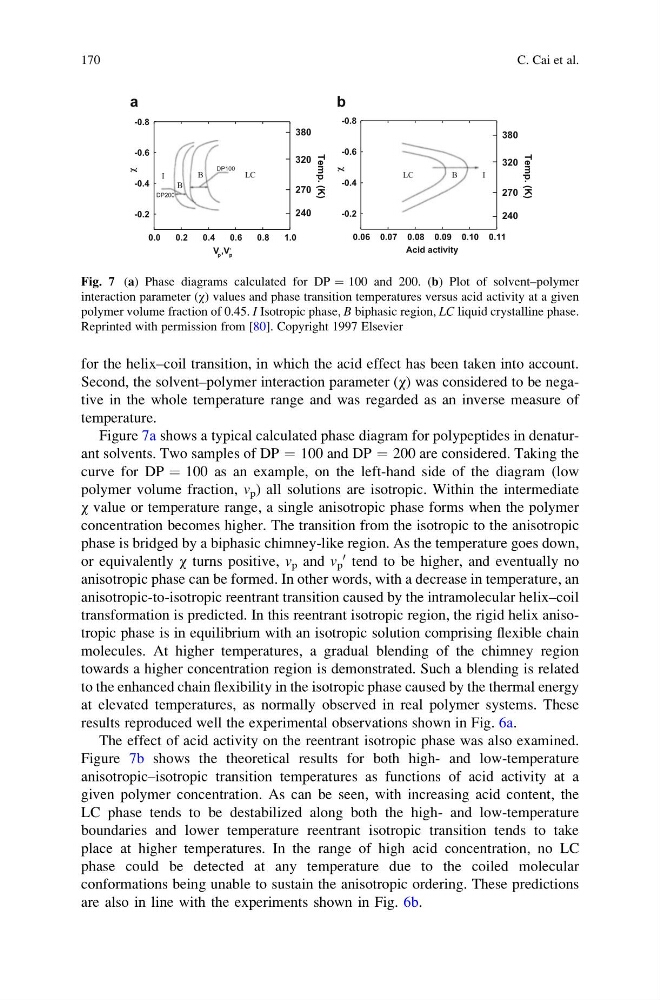
Figure 7a shows a typical calculated phase diagram for polypeptides in denaturant solvents. Two samples of DP ¼ 100 and DP ¼ 200 are considered. Taking the
curve for DP ¼ 100 as an example, on the left-hand side of the diagram (low
polymer volume fraction, v p ) all solutions are isotropic. Within the intermediate
χ value or temperature range, a single anisotropic phase forms when the polymer
concentration becomes higher. The transition from the isotropic to the anisotropic
phase is bridged by a biphasic chimney-like region. As the temperature goes down,
or equivalently χ turns positive, v p and v p
0 tend to be higher, and eventually no
anisotropic phase can be formed. In other words, with a decrease in temperature, an
anisotropic-to-isotropic reentrant transition caused by the intramolecular helix–coil
transformation is predicted. In this reentrant isotropic region, the rigid helix anisotropic phase is in equilibrium with an isotropic solution comprising flexible chain
molecules. At higher temperatures, a gradual blending of the chimney region
towards a higher concentration region is demonstrated. Such a blending is related
to the enhanced chain flexibility in the isotropic phase caused by the thermal energy
at elevated temperatures, as normally observed in real polymer systems. These
results reproduced well the experimental observations shown in Fig. 6a.
The effect of acid activity on the reentrant isotropic phase was also examined.
Figure 7b shows the theoretical results for both high- and low-temperature
anisotropic–isotropic transition temperatures as functions of acid activity at a
given polymer concentration. As can be seen, with increasing acid content, the
LC phase tends to be destabilized along both the high- and low-temperature
boundaries and lower temperature reentrant isotropic transition tends to take
place at higher temperatures. In the range of high acid concentration, no LC
phase could be detected at any temperature due to the coiled molecular
conformations being unable to sustain the anisotropic ordering. These predictions
are also in line with the experiments shown in Fig. 6b.
I
B
B
380
320
270
240
Temp. (K)
DP100
LC
DP200
380
320
270
240
LC
B
I
0.0
0.2
0.4
0.6
0.8
1.0
-0.2
-0.4
-0.6
-0.8
a
V p ,V
,
p
0.06 0.07 0.08 0.09 0.10 0.11
-0.2
-0.4
-0.6
-0.8
b
Acid activity
Temp. (K)
χ
χ
Fig. 7 (a) Phase diagrams calculated for DP ¼ 100 and 200. (b) Plot of solvent–polymer
interaction parameter (χ) values and phase transition temperatures versus acid activity at a given
polymer volume fraction of 0.45. I Isotropic phase, B biphasic region, LC liquid crystalline phase.
Reprinted with permission from [80]. Copyright 1997 Elsevier
170
C. Cai et al.
Second, the solvent–polymer interaction parameter (χ) was considered to be negative in the whole temperature range and was regarded as an inverse measure of
temperature.
Figure 7a shows a typical calculated phase diagram for polypeptides in denaturant solvents. Two samples of DP ¼ 100 and DP ¼ 200 are considered. Taking the
curve for DP ¼ 100 as an example, on the left-hand side of the diagram (low
polymer volume fraction, v p ) all solutions are isotropic. Within the intermediate
χ value or temperature range, a single anisotropic phase forms when the polymer
concentration becomes higher. The transition from the isotropic to the anisotropic
phase is bridged by a biphasic chimney-like region. As the temperature goes down,
or equivalently χ turns positive, v p and v p
0 tend to be higher, and eventually no
anisotropic phase can be formed. In other words, with a decrease in temperature, an
anisotropic-to-isotropic reentrant transition caused by the intramolecular helix–coil
transformation is predicted. In this reentrant isotropic region, the rigid helix anisotropic phase is in equilibrium with an isotropic solution comprising flexible chain
molecules. At higher temperatures, a gradual blending of the chimney region
towards a higher concentration region is demonstrated. Such a blending is related
to the enhanced chain flexibility in the isotropic phase caused by the thermal energy
at elevated temperatures, as normally observed in real polymer systems. These
results reproduced well the experimental observations shown in Fig. 6a.
The effect of acid activity on the reentrant isotropic phase was also examined.
Figure 7b shows the theoretical results for both high- and low-temperature
anisotropic–isotropic transition temperatures as functions of acid activity at a
given polymer concentration. As can be seen, with increasing acid content, the
LC phase tends to be destabilized along both the high- and low-temperature
boundaries and lower temperature reentrant isotropic transition tends to take
place at higher temperatures. In the range of high acid concentration, no LC
phase could be detected at any temperature due to the coiled molecular
conformations being unable to sustain the anisotropic ordering. These predictions
are also in line with the experiments shown in Fig. 6b.
I
B
B
380
320
270
240
Temp. (K)
DP100
LC
DP200
380
320
270
240
LC
B
I
0.0
0.2
0.4
0.6
0.8
1.0
-0.2
-0.4
-0.6
-0.8
a
V p ,V
,
p
0.06 0.07 0.08 0.09 0.10 0.11
-0.2
-0.4
-0.6
-0.8
b
Acid activity
Temp. (K)
χ
χ
Fig. 7 (a) Phase diagrams calculated for DP ¼ 100 and 200. (b) Plot of solvent–polymer
interaction parameter (χ) values and phase transition temperatures versus acid activity at a given
polymer volume fraction of 0.45. I Isotropic phase, B biphasic region, LC liquid crystalline phase.
Reprinted with permission from [80]. Copyright 1997 Elsevier
170
C. Cai et al.