

86
5 Fabrication of Fixed-Bed Hybrid Bioreactor and Hydraulic Studies
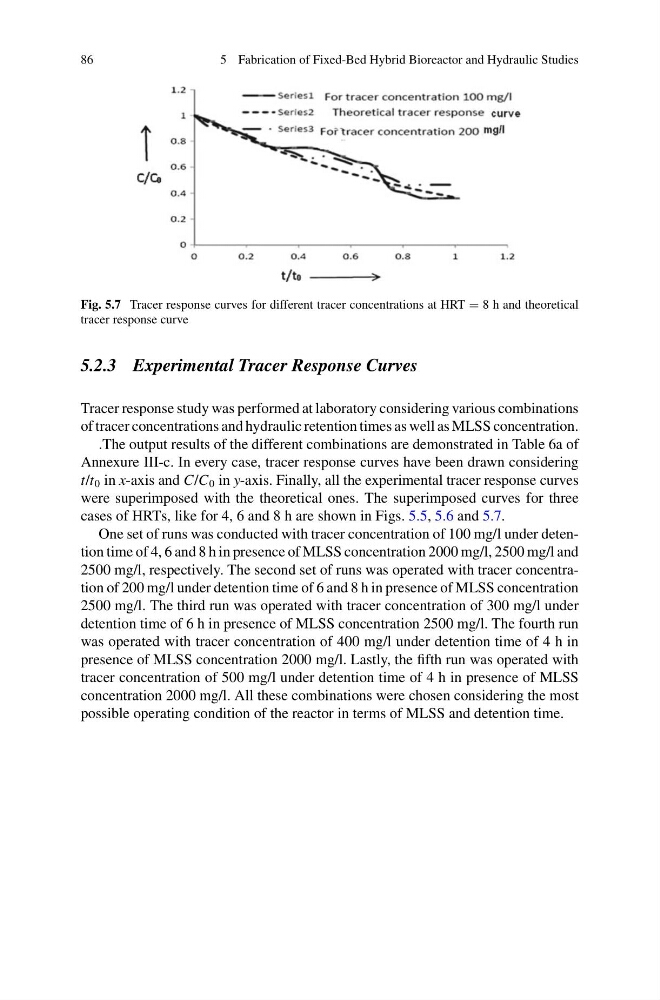
Fig. 5.7 Tracer response curves for different tracer concentrations at HRT = 8 h and theoretical
tracer response curve
5.2.3 Experimental Tracer Response Curves
Tracer response study was performed at laboratory considering various combinations
of tracer concentrations and hydraulic retention times as well as MLSS concentration.
.The output results of the different combinations are demonstrated in Table 6a of
Annexure III-c. In every case, tracer response curves have been drawn considering
t/t 0 in x-axis and C/C 0 in y-axis. Finally, all the experimental tracer response curves
were superimposed with the theoretical ones. The superimposed curves for three
cases of HRTs, like for 4, 6 and 8 h are shown in Figs. 5.5, 5.6 and 5.7.
One set of runs was conducted with tracer concentration of 100 mg/l under detention time of 4, 6 and 8 h in presence of MLSS concentration 2000 mg/l, 2500 mg/l and
2500 mg/l, respectively. The second set of runs was operated with tracer concentration of 200 mg/l under detention time of 6 and 8 h in presence of MLSS concentration
2500 mg/l. The third run was operated with tracer concentration of 300 mg/l under
detention time of 6 h in presence of MLSS concentration 2500 mg/l. The fourth run
was operated with tracer concentration of 400 mg/l under detention time of 4 h in
presence of MLSS concentration 2000 mg/l. Lastly, the fifth run was operated with
tracer concentration of 500 mg/l under detention time of 4 h in presence of MLSS
concentration 2000 mg/l. All these combinations were chosen considering the most
possible operating condition of the reactor in terms of MLSS and detention time.
5 Fabrication of Fixed-Bed Hybrid Bioreactor and Hydraulic Studies
Fig. 5.7 Tracer response curves for different tracer concentrations at HRT = 8 h and theoretical
tracer response curve
5.2.3 Experimental Tracer Response Curves
Tracer response study was performed at laboratory considering various combinations
of tracer concentrations and hydraulic retention times as well as MLSS concentration.
.The output results of the different combinations are demonstrated in Table 6a of
Annexure III-c. In every case, tracer response curves have been drawn considering
t/t 0 in x-axis and C/C 0 in y-axis. Finally, all the experimental tracer response curves
were superimposed with the theoretical ones. The superimposed curves for three
cases of HRTs, like for 4, 6 and 8 h are shown in Figs. 5.5, 5.6 and 5.7.
One set of runs was conducted with tracer concentration of 100 mg/l under detention time of 4, 6 and 8 h in presence of MLSS concentration 2000 mg/l, 2500 mg/l and
2500 mg/l, respectively. The second set of runs was operated with tracer concentration of 200 mg/l under detention time of 6 and 8 h in presence of MLSS concentration
2500 mg/l. The third run was operated with tracer concentration of 300 mg/l under
detention time of 6 h in presence of MLSS concentration 2500 mg/l. The fourth run
was operated with tracer concentration of 400 mg/l under detention time of 4 h in
presence of MLSS concentration 2000 mg/l. Lastly, the fifth run was operated with
tracer concentration of 500 mg/l under detention time of 4 h in presence of MLSS
concentration 2000 mg/l. All these combinations were chosen considering the most
possible operating condition of the reactor in terms of MLSS and detention time.