

5.2 Hydraulic Study on Fixed-Bed Hybrid Bioreactor
85
θ = normalized detention time, i.e., t/τ, where, t = time (minutes), τ = theoretical
detention time (minutes).
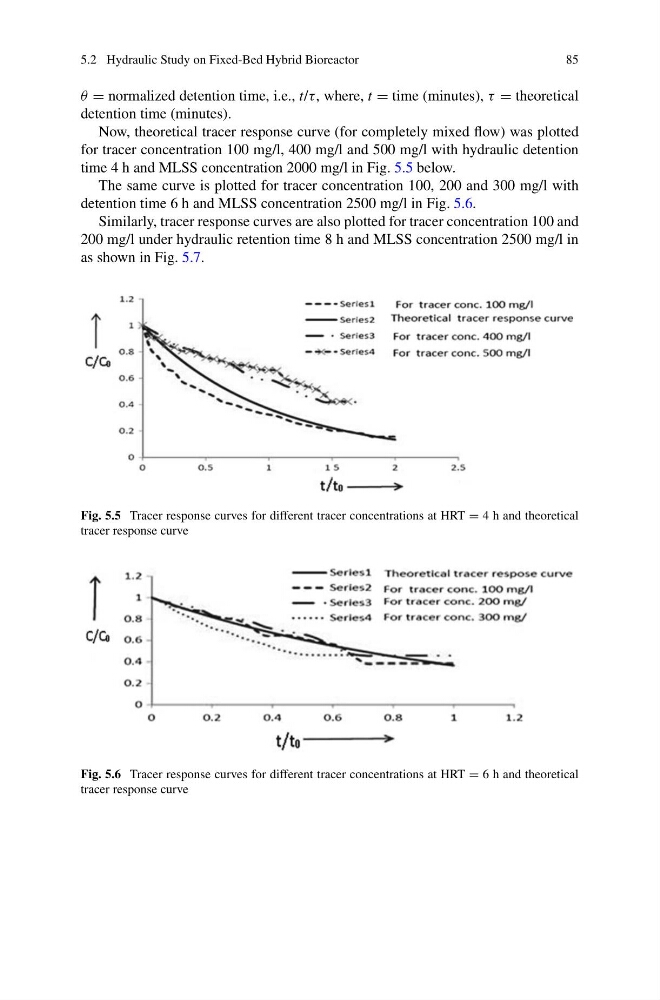
Now, theoretical tracer response curve (for completely mixed flow) was plotted
for tracer concentration 100 mg/l, 400 mg/l and 500 mg/l with hydraulic detention
time 4 h and MLSS concentration 2000 mg/l in Fig. 5.5 below.
The same curve is plotted for tracer concentration 100, 200 and 300 mg/l with
detention time 6 h and MLSS concentration 2500 mg/l in Fig. 5.6.
Similarly, tracer response curves are also plotted for tracer concentration 100 and
200 mg/l under hydraulic retention time 8 h and MLSS concentration 2500 mg/l in
as shown in Fig. 5.7.
Fig. 5.5 Tracer response curves for different tracer concentrations at HRT = 4 h and theoretical
tracer response curve
Fig. 5.6 Tracer response curves for different tracer concentrations at HRT = 6 h and theoretical
tracer response curve
85
θ = normalized detention time, i.e., t/τ, where, t = time (minutes), τ = theoretical
detention time (minutes).
Now, theoretical tracer response curve (for completely mixed flow) was plotted
for tracer concentration 100 mg/l, 400 mg/l and 500 mg/l with hydraulic detention
time 4 h and MLSS concentration 2000 mg/l in Fig. 5.5 below.
The same curve is plotted for tracer concentration 100, 200 and 300 mg/l with
detention time 6 h and MLSS concentration 2500 mg/l in Fig. 5.6.
Similarly, tracer response curves are also plotted for tracer concentration 100 and
200 mg/l under hydraulic retention time 8 h and MLSS concentration 2500 mg/l in
as shown in Fig. 5.7.
Fig. 5.5 Tracer response curves for different tracer concentrations at HRT = 4 h and theoretical
tracer response curve
Fig. 5.6 Tracer response curves for different tracer concentrations at HRT = 6 h and theoretical
tracer response curve