

8.4 Validation of Model Outputs
117
8.4.2 Validation of the Model Output for Case 2 (Continuous
Study with Municipal Wastewater)
A comparison of the output results obtained from mathematical model was made
with those derived from the continuous study using municipal wastewater. The said
comparison table is presented in Table 8.4.
It appears from the comparison table that the model output data are with a little
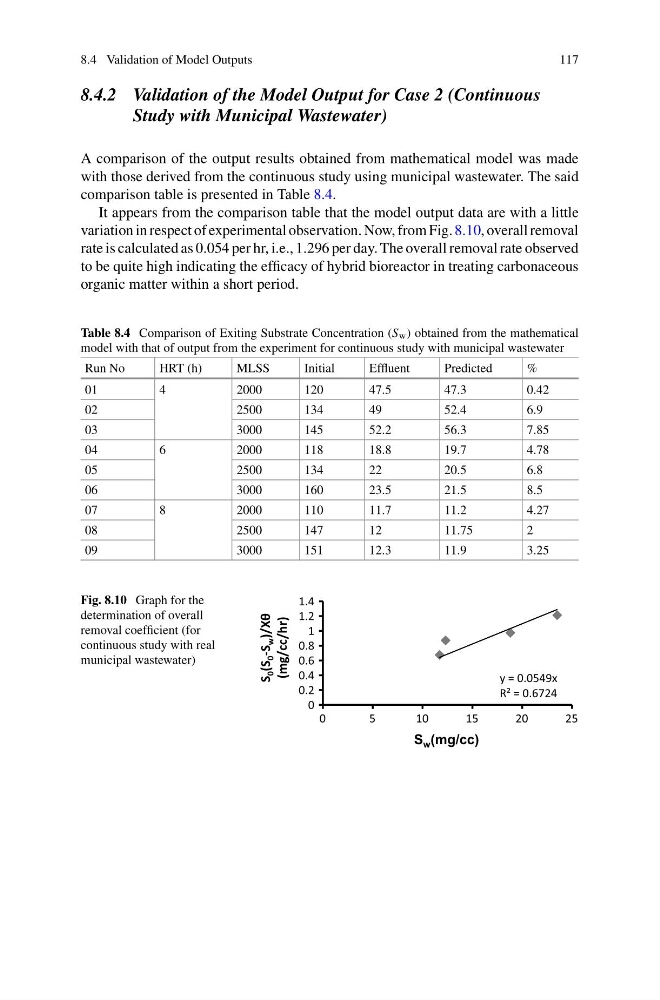
variation in respect of experimental observation. Now, from Fig. 8.10, overall removal
rate is calculated as 0.054 per hr, i.e., 1.296 per day. The overall removal rate observed
to be quite high indicating the efficacy of hybrid bioreactor in treating carbonaceous
organic matter within a short period.
Table 8.4 Comparison of Exiting Substrate Concentration (S w ) obtained from the mathematical
model with that of output from the experiment for continuous study with municipal wastewater
Run No
HRT (h)
MLSS
Initial
Effluent
Predicted
%
01
4
2000
120
47.5
47.3
0.42
02
2500
134
49
52.4
6.9
03
3000
145
52.2
56.3
7.85
04
6
2000
118
18.8
19.7
4.78
05
2500
134
22
20.5
6.8
06
3000
160
23.5
21.5
8.5
07
8
2000
110
11.7
11.2
4.27
08
2500
147
12
11.75
2
09
3000
151
12.3
11.9
3.25
Fig. 8.10 Graph for the
determination of overall
removal coefficient (for
continuous study with real
municipal wastewater)
y = 0.0549x
R² = 0.6724
0
0.2
0.4
0.6
0.8
1
1.2
1.4
0
5
10
15
20
25
S w (mg/cc)
S
0 (S
0 -S
w )/Xθ
(mg/cc/hr)
117
8.4.2 Validation of the Model Output for Case 2 (Continuous
Study with Municipal Wastewater)
A comparison of the output results obtained from mathematical model was made
with those derived from the continuous study using municipal wastewater. The said
comparison table is presented in Table 8.4.
It appears from the comparison table that the model output data are with a little
variation in respect of experimental observation. Now, from Fig. 8.10, overall removal
rate is calculated as 0.054 per hr, i.e., 1.296 per day. The overall removal rate observed
to be quite high indicating the efficacy of hybrid bioreactor in treating carbonaceous
organic matter within a short period.
Table 8.4 Comparison of Exiting Substrate Concentration (S w ) obtained from the mathematical
model with that of output from the experiment for continuous study with municipal wastewater
Run No
HRT (h)
MLSS
Initial
Effluent
Predicted
%
01
4
2000
120
47.5
47.3
0.42
02
2500
134
49
52.4
6.9
03
3000
145
52.2
56.3
7.85
04
6
2000
118
18.8
19.7
4.78
05
2500
134
22
20.5
6.8
06
3000
160
23.5
21.5
8.5
07
8
2000
110
11.7
11.2
4.27
08
2500
147
12
11.75
2
09
3000
151
12.3
11.9
3.25
Fig. 8.10 Graph for the
determination of overall
removal coefficient (for
continuous study with real
municipal wastewater)
y = 0.0549x
R² = 0.6724
0
0.2
0.4
0.6
0.8
1
1.2
1.4
0
5
10
15
20
25
S w (mg/cc)
S
0 (S
0 -S
w )/Xθ
(mg/cc/hr)