

56
R. Dutta et al.
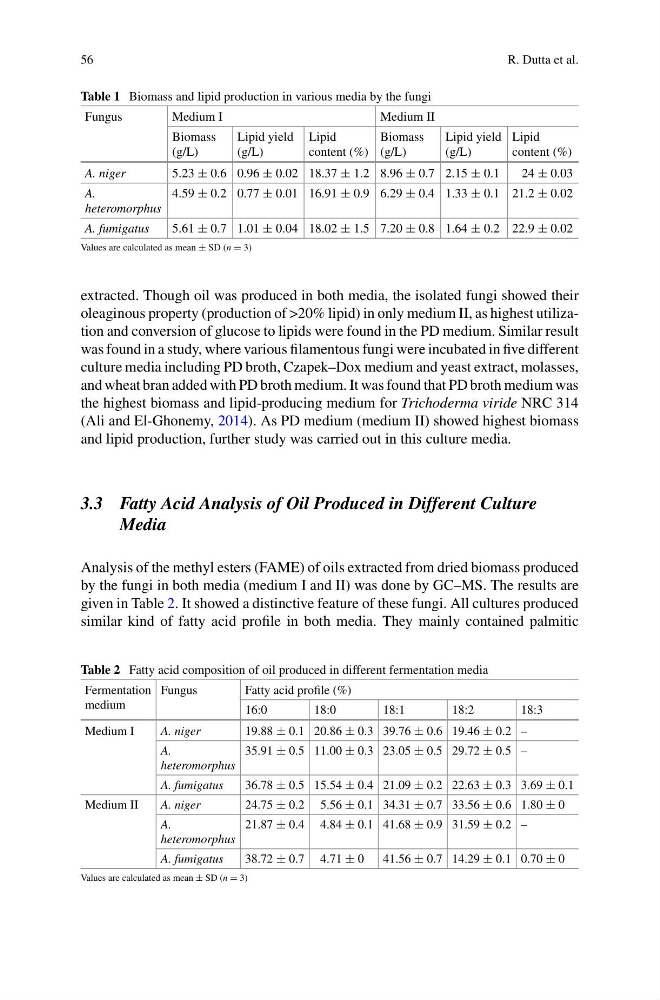
Table 1 Biomass and lipid production in various media by the fungi
Fungus
Medium I
Medium II
Biomass
(g/L)
Lipid yield
(g/L)
Lipid
content (%)
Biomass
(g/L)
Lipid yield
(g/L)
Lipid
content (%)
A. niger
5.23 ± 0.6 0.96 ± 0.02 18.37 ± 1.2 8.96 ± 0.7 2.15 ± 0.1
24 ± 0.03
A.
heteromorphus
4.59 ± 0.2 0.77 ± 0.01 16.91 ± 0.9 6.29 ± 0.4 1.33 ± 0.1 21.2 ± 0.02
A. fumigatus
5.61 ± 0.7 1.01 ± 0.04 18.02 ± 1.5 7.20 ± 0.8 1.64 ± 0.2 22.9 ± 0.02
Values are calculated as mean ± SD (n = 3)
extracted. Though oil was produced in both media, the isolated fungi showed their
oleaginous property (production of >20% lipid) in only medium II, as highest utilization and conversion of glucose to lipids were found in the PD medium. Similar result
was found in a study, where various filamentous fungi were incubated in five different
culture media including PD broth, Czapek–Dox medium and yeast extract, molasses,
and wheat bran added with PD broth medium. It was found that PD broth medium was
the highest biomass and lipid-producing medium for Trichoderma viride NRC 314
(Ali and El-Ghonemy, 2014). As PD medium (medium II) showed highest biomass
and lipid production, further study was carried out in this culture media.
3.3 Fatty Acid Analysis of Oil Produced in Different Culture
Media
Analysis of the methyl esters (FAME) of oils extracted from dried biomass produced
by the fungi in both media (medium I and II) was done by GC–MS. The results are
given in Table 2. It showed a distinctive feature of these fungi. All cultures produced
similar kind of fatty acid profile in both media. They mainly contained palmitic
Table 2 Fatty acid composition of oil produced in different fermentation media
Fermentation
medium
Fungus
Fatty acid profile (%)
16:0
18:0
18:1
18:2
18:3
Medium I
A. niger
19.88 ± 0.1 20.86 ± 0.3 39.76 ± 0.6 19.46 ± 0.2 –
A.
heteromorphus
35.91 ± 0.5 11.00 ± 0.3 23.05 ± 0.5 29.72 ± 0.5 –
A. fumigatus
36.78 ± 0.5 15.54 ± 0.4 21.09 ± 0.2 22.63 ± 0.3 3.69 ± 0.1
Medium II
A. niger
24.75 ± 0.2 5.56 ± 0.1 34.31 ± 0.7 33.56 ± 0.6 1.80 ± 0
A.
heteromorphus
21.87 ± 0.4 4.84 ± 0.1 41.68 ± 0.9 31.59 ± 0.2 –
A. fumigatus
38.72 ± 0.7 4.71 ± 0
41.56 ± 0.7 14.29 ± 0.1 0.70 ± 0
Values are calculated as mean ± SD (n = 3)
R. Dutta et al.
Table 1 Biomass and lipid production in various media by the fungi
Fungus
Medium I
Medium II
Biomass
(g/L)
Lipid yield
(g/L)
Lipid
content (%)
Biomass
(g/L)
Lipid yield
(g/L)
Lipid
content (%)
A. niger
5.23 ± 0.6 0.96 ± 0.02 18.37 ± 1.2 8.96 ± 0.7 2.15 ± 0.1
24 ± 0.03
A.
heteromorphus
4.59 ± 0.2 0.77 ± 0.01 16.91 ± 0.9 6.29 ± 0.4 1.33 ± 0.1 21.2 ± 0.02
A. fumigatus
5.61 ± 0.7 1.01 ± 0.04 18.02 ± 1.5 7.20 ± 0.8 1.64 ± 0.2 22.9 ± 0.02
Values are calculated as mean ± SD (n = 3)
extracted. Though oil was produced in both media, the isolated fungi showed their
oleaginous property (production of >20% lipid) in only medium II, as highest utilization and conversion of glucose to lipids were found in the PD medium. Similar result
was found in a study, where various filamentous fungi were incubated in five different
culture media including PD broth, Czapek–Dox medium and yeast extract, molasses,
and wheat bran added with PD broth medium. It was found that PD broth medium was
the highest biomass and lipid-producing medium for Trichoderma viride NRC 314
(Ali and El-Ghonemy, 2014). As PD medium (medium II) showed highest biomass
and lipid production, further study was carried out in this culture media.
3.3 Fatty Acid Analysis of Oil Produced in Different Culture
Media
Analysis of the methyl esters (FAME) of oils extracted from dried biomass produced
by the fungi in both media (medium I and II) was done by GC–MS. The results are
given in Table 2. It showed a distinctive feature of these fungi. All cultures produced
similar kind of fatty acid profile in both media. They mainly contained palmitic
Table 2 Fatty acid composition of oil produced in different fermentation media
Fermentation
medium
Fungus
Fatty acid profile (%)
16:0
18:0
18:1
18:2
18:3
Medium I
A. niger
19.88 ± 0.1 20.86 ± 0.3 39.76 ± 0.6 19.46 ± 0.2 –
A.
heteromorphus
35.91 ± 0.5 11.00 ± 0.3 23.05 ± 0.5 29.72 ± 0.5 –
A. fumigatus
36.78 ± 0.5 15.54 ± 0.4 21.09 ± 0.2 22.63 ± 0.3 3.69 ± 0.1
Medium II
A. niger
24.75 ± 0.2 5.56 ± 0.1 34.31 ± 0.7 33.56 ± 0.6 1.80 ± 0
A.
heteromorphus
21.87 ± 0.4 4.84 ± 0.1 41.68 ± 0.9 31.59 ± 0.2 –
A. fumigatus
38.72 ± 0.7 4.71 ± 0
41.56 ± 0.7 14.29 ± 0.1 0.70 ± 0
Values are calculated as mean ± SD (n = 3)