

420
A. Dey et al.
not showing proper peaks. The solution was diluted by keeping the solvent amount
fixed and reducing the powder sample 2.0 gm to 0.5 gm. This time 0.5 gm powder
containing sample showed peaks. Again the solutions were treated with various
absorption medium starting from Al 2 O 3 , SiO 2 , TiO 2 , ZnO with the 0.5 gm powder
sample as shown in Fig. 3b. It reveals that the untreated sample is showing a sharp
peak at 432 nm, 460 nm, and 489 nm. It was also observed that treating with different
absorption medium peak absorbance became reduced. But interestingly treating with
Al 2 O 3 absorption medium showed a peak with greater absorption than the other
treated materials. Further experimentation was carried with samples treated with
Al 2 O 3 .
3.4 FTIR Spectroscopical Observation
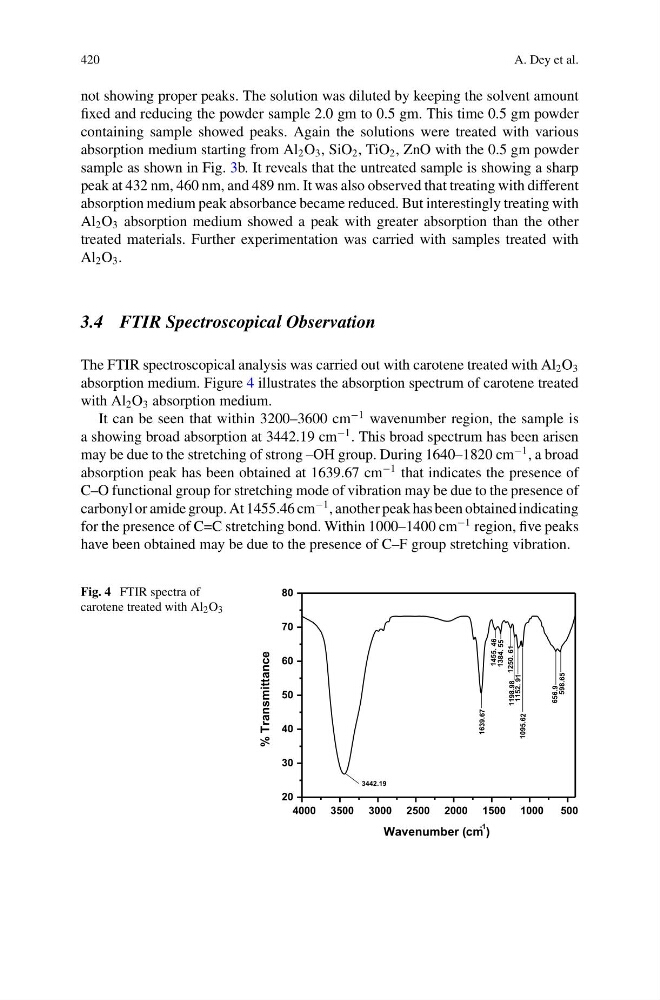
The FTIR spectroscopical analysis was carried out with carotene treated with Al 2 O 3
absorption medium. Figure 4 illustrates the absorption spectrum of carotene treated
with Al 2 O 3 absorption medium.
It can be seen that within 3200–3600 cm
−1 wavenumber region, the sample is
a showing broad absorption at 3442.19 cm
−1 . This broad spectrum has been arisen
may be due to the stretching of strong –OH group. During 1640–1820 cm
−1 , a broad
absorption peak has been obtained at 1639.67 cm
−1 that indicates the presence of
C–O functional group for stretching mode of vibration may be due to the presence of
carbonyl or amide group. At 1455.46 cm
−1 , another peak has been obtained indicating
for the presence of C=C stretching bond. Within 1000–1400 cm
−1 region, five peaks
have been obtained may be due to the presence of C–F group stretching vibration.
Fig. 4 FTIR spectra of
carotene treated with Al 2 O 3
4000 3500 3000 2500 2000 1500 1000
500
20
30
40
50
60
70
80
5
6
.
8
9
5
9
.
6
5
6
1095.62
1152. 91
1198.98
1250. 61
1384. 55
1455. 46
1639.67
% Transmittance
Wavenumber (cm
-1
)
3442.19
A. Dey et al.
not showing proper peaks. The solution was diluted by keeping the solvent amount
fixed and reducing the powder sample 2.0 gm to 0.5 gm. This time 0.5 gm powder
containing sample showed peaks. Again the solutions were treated with various
absorption medium starting from Al 2 O 3 , SiO 2 , TiO 2 , ZnO with the 0.5 gm powder
sample as shown in Fig. 3b. It reveals that the untreated sample is showing a sharp
peak at 432 nm, 460 nm, and 489 nm. It was also observed that treating with different
absorption medium peak absorbance became reduced. But interestingly treating with
Al 2 O 3 absorption medium showed a peak with greater absorption than the other
treated materials. Further experimentation was carried with samples treated with
Al 2 O 3 .
3.4 FTIR Spectroscopical Observation
The FTIR spectroscopical analysis was carried out with carotene treated with Al 2 O 3
absorption medium. Figure 4 illustrates the absorption spectrum of carotene treated
with Al 2 O 3 absorption medium.
It can be seen that within 3200–3600 cm
−1 wavenumber region, the sample is
a showing broad absorption at 3442.19 cm
−1 . This broad spectrum has been arisen
may be due to the stretching of strong –OH group. During 1640–1820 cm
−1 , a broad
absorption peak has been obtained at 1639.67 cm
−1 that indicates the presence of
C–O functional group for stretching mode of vibration may be due to the presence of
carbonyl or amide group. At 1455.46 cm
−1 , another peak has been obtained indicating
for the presence of C=C stretching bond. Within 1000–1400 cm
−1 region, five peaks
have been obtained may be due to the presence of C–F group stretching vibration.
Fig. 4 FTIR spectra of
carotene treated with Al 2 O 3
4000 3500 3000 2500 2000 1500 1000
500
20
30
40
50
60
70
80
5
6
.
8
9
5
9
.
6
5
6
1095.62
1152. 91
1198.98
1250. 61
1384. 55
1455. 46
1639.67
% Transmittance
Wavenumber (cm
-1
)
3442.19