

Performance Enhancement of Dye-Sensitized Solar Cell Using …
419
Fig. 2 SEM image of
extracted carotene
3.2 Structural Observation
Figure 2 shows the Scanning Electron Microscope (SEM) micrograph of carotene
extracted from carrot. From the figure, it is clear that the structure is distributed with
small pores.
3.3 UV–Vis Spectroscopic Observation
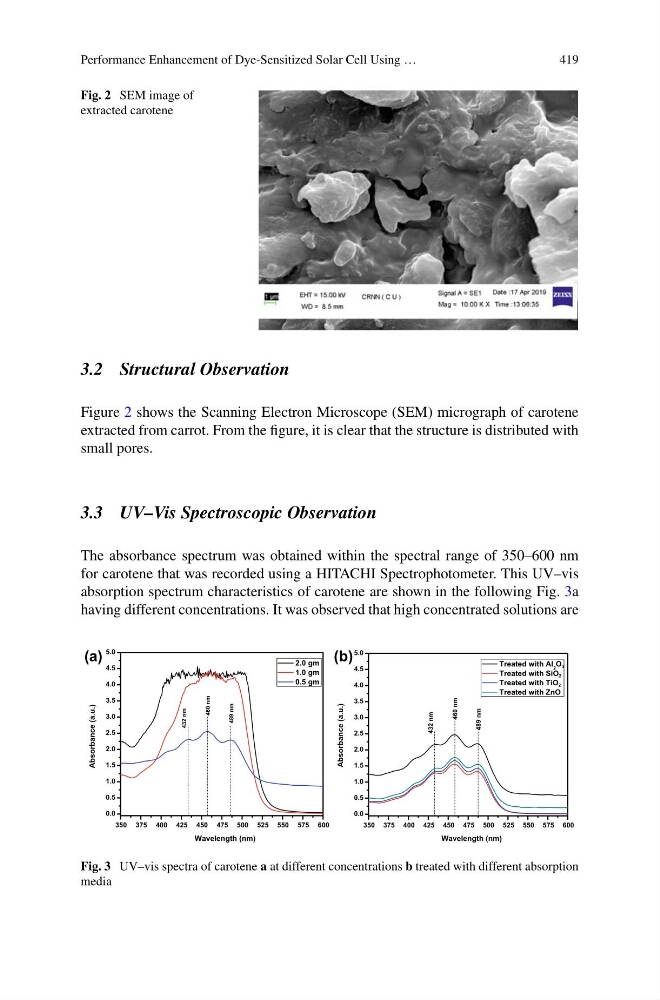
The absorbance spectrum was obtained within the spectral range of 350–600 nm
for carotene that was recorded using a HITACHI Spectrophotometer. This UV–vis
absorption spectrum characteristics of carotene are shown in the following Fig. 3a
having different concentrations. It was observed that high concentrated solutions are
350 375 400 425 450 475 500 525 550 575 600
0.0
0.5
1.0
1.5
2.0
2.5
3.0
3.5
4.0
4.5
5.0
489 nm
460 nm
Absorbance (a.u.)
Wavelength (nm)
2.0 gm
1.0 gm
0.5 gm
432 nm
(a)
350 375 400 425 450 475 500 525 550 575 600
0.0
0.5
1.0
1.5
2.0
2.5
3.0
3.5
4.0
4.5
5.0
460 nm
489 nm
Absorbance (a.u.)
Wavelength (nm)
Treated with Al 2 O3
Treated with SiO2
Treated with TiO2
Treated with ZnO
432 nm
(b)
Fig. 3 UV–vis spectra of carotene a at different concentrations b treated with different absorption
media
419
Fig. 2 SEM image of
extracted carotene
3.2 Structural Observation
Figure 2 shows the Scanning Electron Microscope (SEM) micrograph of carotene
extracted from carrot. From the figure, it is clear that the structure is distributed with
small pores.
3.3 UV–Vis Spectroscopic Observation
The absorbance spectrum was obtained within the spectral range of 350–600 nm
for carotene that was recorded using a HITACHI Spectrophotometer. This UV–vis
absorption spectrum characteristics of carotene are shown in the following Fig. 3a
having different concentrations. It was observed that high concentrated solutions are
350 375 400 425 450 475 500 525 550 575 600
0.0
0.5
1.0
1.5
2.0
2.5
3.0
3.5
4.0
4.5
5.0
489 nm
460 nm
Absorbance (a.u.)
Wavelength (nm)
2.0 gm
1.0 gm
0.5 gm
432 nm
(a)
350 375 400 425 450 475 500 525 550 575 600
0.0
0.5
1.0
1.5
2.0
2.5
3.0
3.5
4.0
4.5
5.0
460 nm
489 nm
Absorbance (a.u.)
Wavelength (nm)
Treated with Al 2 O3
Treated with SiO2
Treated with TiO2
Treated with ZnO
432 nm
(b)
Fig. 3 UV–vis spectra of carotene a at different concentrations b treated with different absorption
media