

388
D. Raha et al.
0
30
60
0
8
16
24
32
40
48
Residual NH
4
+
-N
Concentration (mg/L as N)
Time (hr)
Initial MLSS (356 mg/L)
Initial MLSS (389 mg/L)
Initial MLSS (421 mg/L)
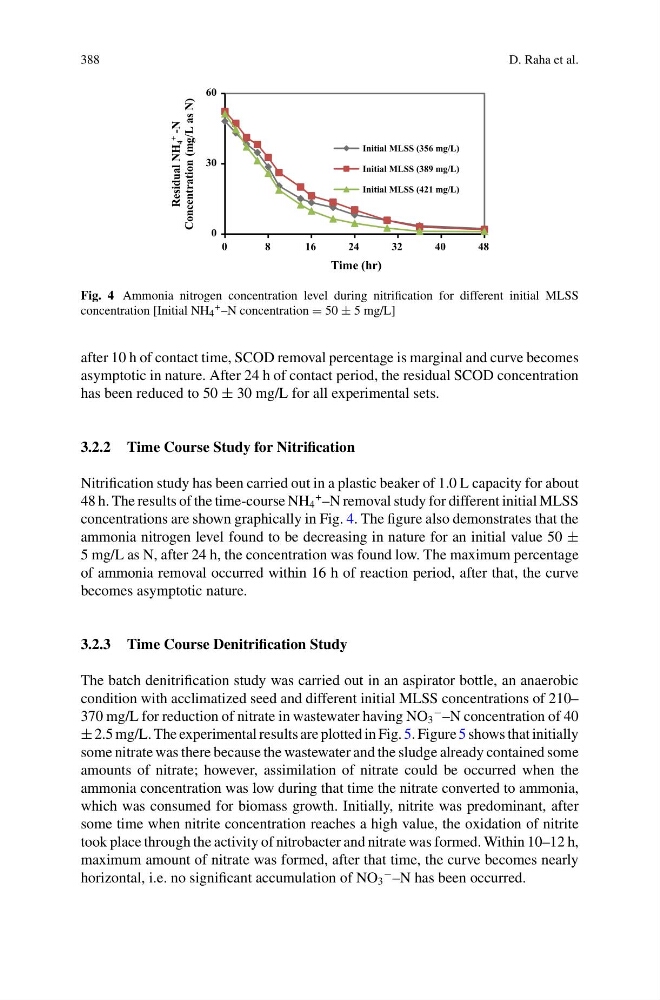
Fig. 4 Ammonia nitrogen concentration level during nitrification for different initial MLSS
concentration [Initial NH 4
+ –N concentration = 50 ± 5 mg/L]
after 10 h of contact time, SCOD removal percentage is marginal and curve becomes
asymptotic in nature. After 24 h of contact period, the residual SCOD concentration
has been reduced to 50 ± 30 mg/L for all experimental sets.
3.2.2 Time Course Study for Nitrification
Nitrification study has been carried out in a plastic beaker of 1.0 L capacity for about
48 h. The results of the time-course NH 4
+ –N removal study for different initial MLSS
concentrations are shown graphically in Fig. 4. The figure also demonstrates that the
ammonia nitrogen level found to be decreasing in nature for an initial value 50 ±
5 mg/L as N, after 24 h, the concentration was found low. The maximum percentage
of ammonia removal occurred within 16 h of reaction period, after that, the curve
becomes asymptotic nature.
3.2.3 Time Course Denitrification Study
The batch denitrification study was carried out in an aspirator bottle, an anaerobic
condition with acclimatized seed and different initial MLSS concentrations of 210–
370 mg/L for reduction of nitrate in wastewater having NO 3
− –N concentration of 40
± 2.5 mg/L. The experimental results are plotted in Fig. 5. Figure 5 shows that initially
some nitrate was there because the wastewater and the sludge already contained some
amounts of nitrate; however, assimilation of nitrate could be occurred when the
ammonia concentration was low during that time the nitrate converted to ammonia,
which was consumed for biomass growth. Initially, nitrite was predominant, after
some time when nitrite concentration reaches a high value, the oxidation of nitrite
took place through the activity of nitrobacter and nitrate was formed. Within 10–12 h,
maximum amount of nitrate was formed, after that time, the curve becomes nearly
horizontal, i.e. no significant accumulation of NO 3
− –N has been occurred.
D. Raha et al.
0
30
60
0
8
16
24
32
40
48
Residual NH
4
+
-N
Concentration (mg/L as N)
Time (hr)
Initial MLSS (356 mg/L)
Initial MLSS (389 mg/L)
Initial MLSS (421 mg/L)
Fig. 4 Ammonia nitrogen concentration level during nitrification for different initial MLSS
concentration [Initial NH 4
+ –N concentration = 50 ± 5 mg/L]
after 10 h of contact time, SCOD removal percentage is marginal and curve becomes
asymptotic in nature. After 24 h of contact period, the residual SCOD concentration
has been reduced to 50 ± 30 mg/L for all experimental sets.
3.2.2 Time Course Study for Nitrification
Nitrification study has been carried out in a plastic beaker of 1.0 L capacity for about
48 h. The results of the time-course NH 4
+ –N removal study for different initial MLSS
concentrations are shown graphically in Fig. 4. The figure also demonstrates that the
ammonia nitrogen level found to be decreasing in nature for an initial value 50 ±
5 mg/L as N, after 24 h, the concentration was found low. The maximum percentage
of ammonia removal occurred within 16 h of reaction period, after that, the curve
becomes asymptotic nature.
3.2.3 Time Course Denitrification Study
The batch denitrification study was carried out in an aspirator bottle, an anaerobic
condition with acclimatized seed and different initial MLSS concentrations of 210–
370 mg/L for reduction of nitrate in wastewater having NO 3
− –N concentration of 40
± 2.5 mg/L. The experimental results are plotted in Fig. 5. Figure 5 shows that initially
some nitrate was there because the wastewater and the sludge already contained some
amounts of nitrate; however, assimilation of nitrate could be occurred when the
ammonia concentration was low during that time the nitrate converted to ammonia,
which was consumed for biomass growth. Initially, nitrite was predominant, after
some time when nitrite concentration reaches a high value, the oxidation of nitrite
took place through the activity of nitrobacter and nitrate was formed. Within 10–12 h,
maximum amount of nitrate was formed, after that time, the curve becomes nearly
horizontal, i.e. no significant accumulation of NO 3
− –N has been occurred.