

Performance and Kinetic Studies of Dairy Effluent Using Mixed Culture …
389
0
20
40
0
1 2
2 4
3 6
4 8
Residual NO
3
-
-N Concentration (mg/L as N)
Time (hr)
Initial MLSS (211mg/L)
Initial MLSS (275 mg/L)
Initial MLSS (368 mg/L)
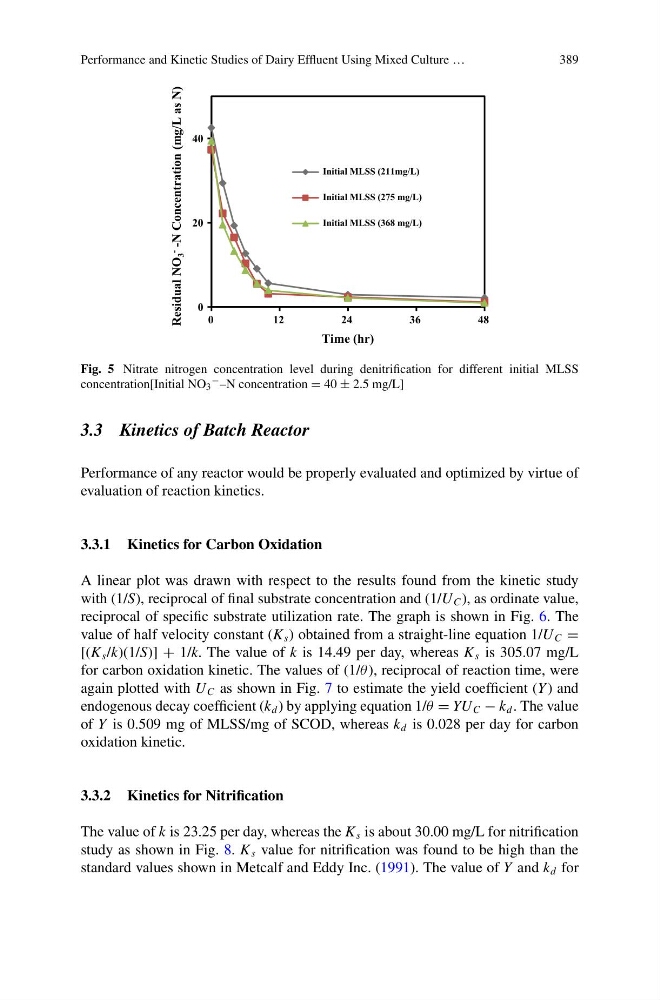
Fig. 5 Nitrate nitrogen concentration level during denitrification for different initial MLSS
concentration[Initial NO 3
− –N concentration = 40 ± 2.5 mg/L]
3.3 Kinetics of Batch Reactor
Performance of any reactor would be properly evaluated and optimized by virtue of
evaluation of reaction kinetics.
3.3.1 Kinetics for Carbon Oxidation
A linear plot was drawn with respect to the results found from the kinetic study
with (1/S), reciprocal of final substrate concentration and (1/U C ), as ordinate value,
reciprocal of specific substrate utilization rate. The graph is shown in Fig. 6. The
value of half velocity constant (K s ) obtained from a straight-line equation 1/U C =
[(K s /k)(1/S)] + 1/k. The value of k is 14.49 per day, whereas K s is 305.07 mg/L
for carbon oxidation kinetic. The values of (1/θ ), reciprocal of reaction time, were
again plotted with U C as shown in Fig. 7 to estimate the yield coefficient (Y ) and
endogenous decay coefficient (k d ) by applying equation 1/θ = YU C − k d . The value
of Y is 0.509 mg of MLSS/mg of SCOD, whereas k d is 0.028 per day for carbon
oxidation kinetic.
3.3.2 Kinetics for Nitrification
The value of k is 23.25 per day, whereas the K s is about 30.00 mg/L for nitrification
study as shown in Fig. 8. K s value for nitrification was found to be high than the
standard values shown in Metcalf and Eddy Inc. (1991). The value of Y and k d for
389
0
20
40
0
1 2
2 4
3 6
4 8
Residual NO
3
-
-N Concentration (mg/L as N)
Time (hr)
Initial MLSS (211mg/L)
Initial MLSS (275 mg/L)
Initial MLSS (368 mg/L)
Fig. 5 Nitrate nitrogen concentration level during denitrification for different initial MLSS
concentration[Initial NO 3
− –N concentration = 40 ± 2.5 mg/L]
3.3 Kinetics of Batch Reactor
Performance of any reactor would be properly evaluated and optimized by virtue of
evaluation of reaction kinetics.
3.3.1 Kinetics for Carbon Oxidation
A linear plot was drawn with respect to the results found from the kinetic study
with (1/S), reciprocal of final substrate concentration and (1/U C ), as ordinate value,
reciprocal of specific substrate utilization rate. The graph is shown in Fig. 6. The
value of half velocity constant (K s ) obtained from a straight-line equation 1/U C =
[(K s /k)(1/S)] + 1/k. The value of k is 14.49 per day, whereas K s is 305.07 mg/L
for carbon oxidation kinetic. The values of (1/θ ), reciprocal of reaction time, were
again plotted with U C as shown in Fig. 7 to estimate the yield coefficient (Y ) and
endogenous decay coefficient (k d ) by applying equation 1/θ = YU C − k d . The value
of Y is 0.509 mg of MLSS/mg of SCOD, whereas k d is 0.028 per day for carbon
oxidation kinetic.
3.3.2 Kinetics for Nitrification
The value of k is 23.25 per day, whereas the K s is about 30.00 mg/L for nitrification
study as shown in Fig. 8. K s value for nitrification was found to be high than the
standard values shown in Metcalf and Eddy Inc. (1991). The value of Y and k d for