

Performance and Kinetic Studies of Dairy Effluent Using Mixed Culture …
387
Table 1 Characterization of dairy wastewater (pre-treated)
Parameters
Maximum
Minimum
Mean
SD
SCOD (mg/L)
1361.2
1116.7
1240.63
100.14
pH
8.32
8.18
8.25
0.06
TSS (mg/L)
1850.0
1520
1680.00
134.91
TS (mg/L)
5380
4300
4882.50
451.84
BOD 5 (mg/L)
898.0
788.6
828.25
48.66
Alkalinity (mg/L as CaCO 3 )
593.0
562.0
577.50
12.82
NH 4
+ –N (mg/L as N)
58.13
41.40
49.95
7.01
NO 3
− –N (mg/L as N)
23.96
19.75
21.54
1.76
DO (mg/L)
1.60
1.20
1.40
0.18
3.2 Performance Evaluation of Batch Reactor
This study was conducted for exploring the removal kinetics of COD and NH 4
+ –N
with time, with the help of acclimatizing seed and also for determining the kinetic
constants for designing of a prototype aeration tank for treatment of real-life dairy
wastewater.
3.2.1 Time Course Study for Carbon Oxidation
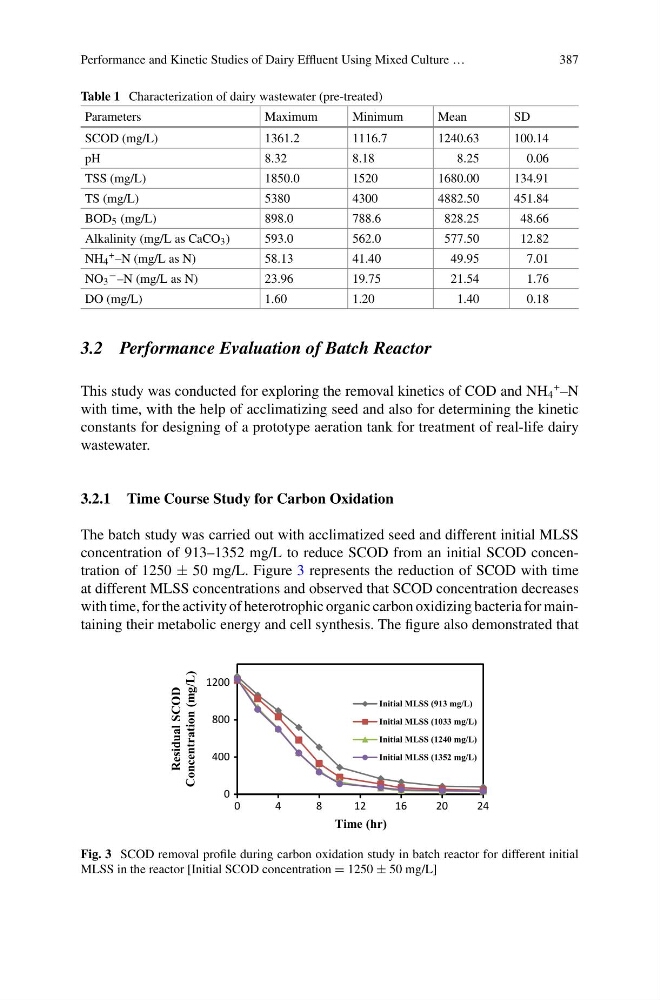
The batch study was carried out with acclimatized seed and different initial MLSS
concentration of 913–1352 mg/L to reduce SCOD from an initial SCOD concentration of 1250 ± 50 mg/L. Figure 3 represents the reduction of SCOD with time
at different MLSS concentrations and observed that SCOD concentration decreases
with time, for the activity of heterotrophic organic carbon oxidizing bacteria for maintaining their metabolic energy and cell synthesis. The figure also demonstrated that
0
400
800
1200
0
4
8
1 2
1 6
2 0
2 4
Residual SCOD
Concentration (mg/L)
Time (hr)
Initial MLSS (913 mg/L)
Initial MLSS (1033 mg/L)
Initial MLSS (1240 mg/L)
Initial MLSS (1352 mg/L)
Fig. 3 SCOD removal profile during carbon oxidation study in batch reactor for different initial
MLSS in the reactor [Initial SCOD concentration = 1250 ± 50 mg/L]
387
Table 1 Characterization of dairy wastewater (pre-treated)
Parameters
Maximum
Minimum
Mean
SD
SCOD (mg/L)
1361.2
1116.7
1240.63
100.14
pH
8.32
8.18
8.25
0.06
TSS (mg/L)
1850.0
1520
1680.00
134.91
TS (mg/L)
5380
4300
4882.50
451.84
BOD 5 (mg/L)
898.0
788.6
828.25
48.66
Alkalinity (mg/L as CaCO 3 )
593.0
562.0
577.50
12.82
NH 4
+ –N (mg/L as N)
58.13
41.40
49.95
7.01
NO 3
− –N (mg/L as N)
23.96
19.75
21.54
1.76
DO (mg/L)
1.60
1.20
1.40
0.18
3.2 Performance Evaluation of Batch Reactor
This study was conducted for exploring the removal kinetics of COD and NH 4
+ –N
with time, with the help of acclimatizing seed and also for determining the kinetic
constants for designing of a prototype aeration tank for treatment of real-life dairy
wastewater.
3.2.1 Time Course Study for Carbon Oxidation
The batch study was carried out with acclimatized seed and different initial MLSS
concentration of 913–1352 mg/L to reduce SCOD from an initial SCOD concentration of 1250 ± 50 mg/L. Figure 3 represents the reduction of SCOD with time
at different MLSS concentrations and observed that SCOD concentration decreases
with time, for the activity of heterotrophic organic carbon oxidizing bacteria for maintaining their metabolic energy and cell synthesis. The figure also demonstrated that
0
400
800
1200
0
4
8
1 2
1 6
2 0
2 4
Residual SCOD
Concentration (mg/L)
Time (hr)
Initial MLSS (913 mg/L)
Initial MLSS (1033 mg/L)
Initial MLSS (1240 mg/L)
Initial MLSS (1352 mg/L)
Fig. 3 SCOD removal profile during carbon oxidation study in batch reactor for different initial
MLSS in the reactor [Initial SCOD concentration = 1250 ± 50 mg/L]