

386
D. Raha et al.
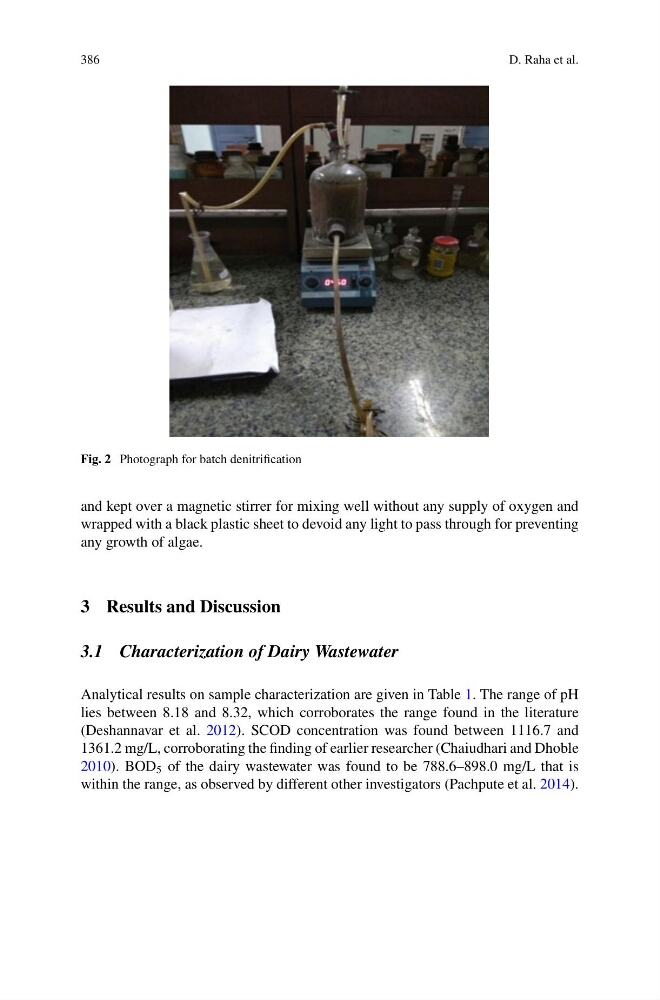
Fig. 2 Photograph for batch denitrification
and kept over a magnetic stirrer for mixing well without any supply of oxygen and
wrapped with a black plastic sheet to devoid any light to pass through for preventing
any growth of algae.
3 Results and Discussion
3.1 Characterization of Dairy Wastewater
Analytical results on sample characterization are given in Table 1. The range of pH
lies between 8.18 and 8.32, which corroborates the range found in the literature
(Deshannavar et al. 2012). SCOD concentration was found between 1116.7 and
1361.2 mg/L, corroborating the finding of earlier researcher (Chaiudhari and Dhoble
2010). BOD 5 of the dairy wastewater was found to be 788.6–898.0 mg/L that is
within the range, as observed by different other investigators (Pachpute et al. 2014).
D. Raha et al.
Fig. 2 Photograph for batch denitrification
and kept over a magnetic stirrer for mixing well without any supply of oxygen and
wrapped with a black plastic sheet to devoid any light to pass through for preventing
any growth of algae.
3 Results and Discussion
3.1 Characterization of Dairy Wastewater
Analytical results on sample characterization are given in Table 1. The range of pH
lies between 8.18 and 8.32, which corroborates the range found in the literature
(Deshannavar et al. 2012). SCOD concentration was found between 1116.7 and
1361.2 mg/L, corroborating the finding of earlier researcher (Chaiudhari and Dhoble
2010). BOD 5 of the dairy wastewater was found to be 788.6–898.0 mg/L that is
within the range, as observed by different other investigators (Pachpute et al. 2014).