

Synthesis and Characterization of MgO Nanoparticle …
205
Table 1 Measurement of concentration of hemoglobin release by the RBCs
Conc. of MgO NPs
5 mg/ml
15 mg/ml
25 mg/ml
−ve control
Absorbance (Mean ± SD) 46.76 ± 0.37b 40.93 ± 0.93b 17.87 ± 0.68c 2.17 ± 0.18a
Similar alphabets show non-significance and different alphabets show significance among the group
implying RBCs cytotoxicity. Present study reveals that there is a significant (p <
0.1) increase of cytotoxicity caused by MgO NPs. But toxicity is higher in lower
concentration of MgO treatment in comparison to the higher concentration of MgO
treatment.
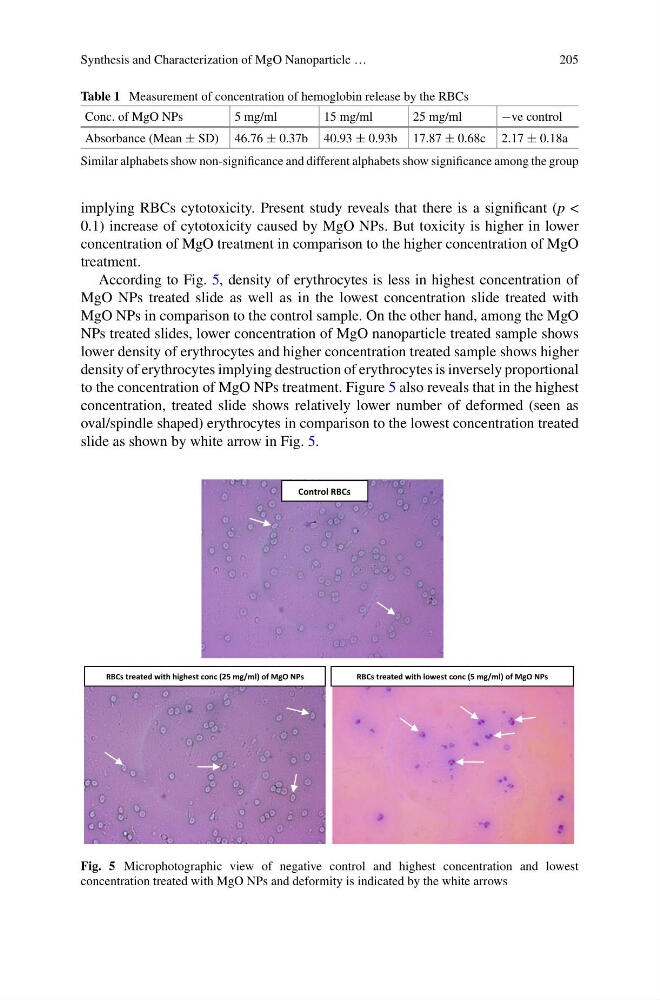
According to Fig. 5, density of erythrocytes is less in highest concentration of
MgO NPs treated slide as well as in the lowest concentration slide treated with
MgO NPs in comparison to the control sample. On the other hand, among the MgO
NPs treated slides, lower concentration of MgO nanoparticle treated sample shows
lower density of erythrocytes and higher concentration treated sample shows higher
density of erythrocytes implying destruction of erythrocytes is inversely proportional
to the concentration of MgO NPs treatment. Figure 5 also reveals that in the highest
concentration, treated slide shows relatively lower number of deformed (seen as
oval/spindle shaped) erythrocytes in comparison to the lowest concentration treated
slide as shown by white arrow in Fig. 5.
RBCs
RBCs
Control RBCs
Fig. 5 Microphotographic view of negative control and highest concentration and lowest
concentration treated with MgO NPs and deformity is indicated by the white arrows
205
Table 1 Measurement of concentration of hemoglobin release by the RBCs
Conc. of MgO NPs
5 mg/ml
15 mg/ml
25 mg/ml
−ve control
Absorbance (Mean ± SD) 46.76 ± 0.37b 40.93 ± 0.93b 17.87 ± 0.68c 2.17 ± 0.18a
Similar alphabets show non-significance and different alphabets show significance among the group
implying RBCs cytotoxicity. Present study reveals that there is a significant (p <
0.1) increase of cytotoxicity caused by MgO NPs. But toxicity is higher in lower
concentration of MgO treatment in comparison to the higher concentration of MgO
treatment.
According to Fig. 5, density of erythrocytes is less in highest concentration of
MgO NPs treated slide as well as in the lowest concentration slide treated with
MgO NPs in comparison to the control sample. On the other hand, among the MgO
NPs treated slides, lower concentration of MgO nanoparticle treated sample shows
lower density of erythrocytes and higher concentration treated sample shows higher
density of erythrocytes implying destruction of erythrocytes is inversely proportional
to the concentration of MgO NPs treatment. Figure 5 also reveals that in the highest
concentration, treated slide shows relatively lower number of deformed (seen as
oval/spindle shaped) erythrocytes in comparison to the lowest concentration treated
slide as shown by white arrow in Fig. 5.
RBCs
RBCs
Control RBCs
Fig. 5 Microphotographic view of negative control and highest concentration and lowest
concentration treated with MgO NPs and deformity is indicated by the white arrows