

204
B. Boro et al.
a
b
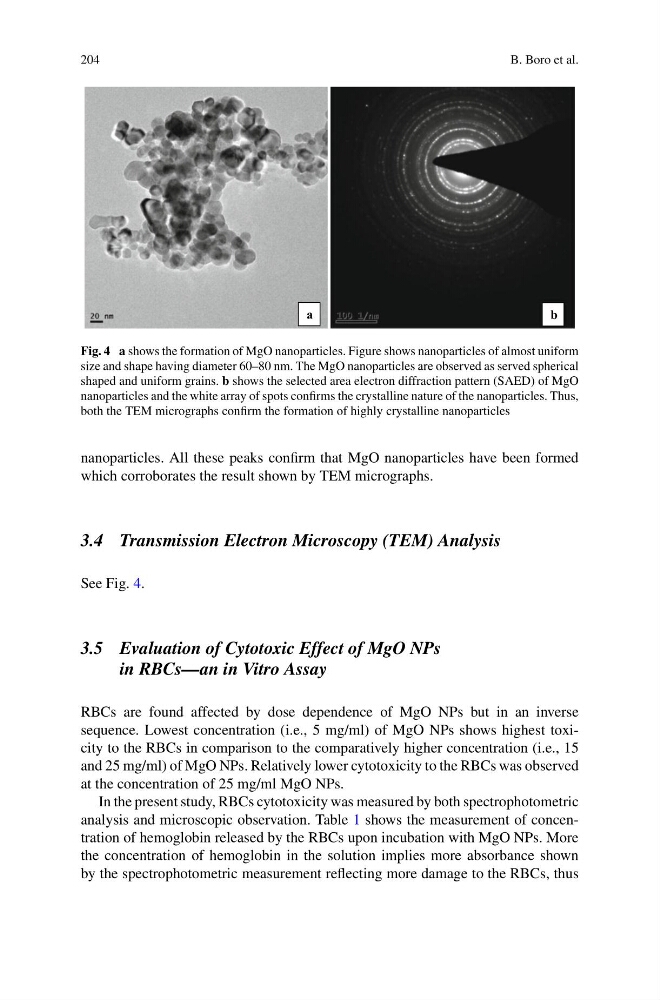
Fig. 4 a shows the formation of MgO nanoparticles. Figure shows nanoparticles of almost uniform
size and shape having diameter 60–80 nm. The MgO nanoparticles are observed as served spherical
shaped and uniform grains. b shows the selected area electron diffraction pattern (SAED) of MgO
nanoparticles and the white array of spots confirms the crystalline nature of the nanoparticles. Thus,
both the TEM micrographs confirm the formation of highly crystalline nanoparticles
nanoparticles. All these peaks confirm that MgO nanoparticles have been formed
which corroborates the result shown by TEM micrographs.
3.4 Transmission Electron Microscopy (TEM) Analysis
See Fig. 4.
3.5 Evaluation of Cytotoxic Effect of MgO NPs
in RBCs—an in Vitro Assay
RBCs are found affected by dose dependence of MgO NPs but in an inverse
sequence. Lowest concentration (i.e., 5 mg/ml) of MgO NPs shows highest toxicity to the RBCs in comparison to the comparatively higher concentration (i.e., 15
and 25 mg/ml) of MgO NPs. Relatively lower cytotoxicity to the RBCs was observed
at the concentration of 25 mg/ml MgO NPs.
In the present study, RBCs cytotoxicity was measured by both spectrophotometric
analysis and microscopic observation. Table 1 shows the measurement of concentration of hemoglobin released by the RBCs upon incubation with MgO NPs. More
the concentration of hemoglobin in the solution implies more absorbance shown
by the spectrophotometric measurement reflecting more damage to the RBCs, thus
B. Boro et al.
a
b
Fig. 4 a shows the formation of MgO nanoparticles. Figure shows nanoparticles of almost uniform
size and shape having diameter 60–80 nm. The MgO nanoparticles are observed as served spherical
shaped and uniform grains. b shows the selected area electron diffraction pattern (SAED) of MgO
nanoparticles and the white array of spots confirms the crystalline nature of the nanoparticles. Thus,
both the TEM micrographs confirm the formation of highly crystalline nanoparticles
nanoparticles. All these peaks confirm that MgO nanoparticles have been formed
which corroborates the result shown by TEM micrographs.
3.4 Transmission Electron Microscopy (TEM) Analysis
See Fig. 4.
3.5 Evaluation of Cytotoxic Effect of MgO NPs
in RBCs—an in Vitro Assay
RBCs are found affected by dose dependence of MgO NPs but in an inverse
sequence. Lowest concentration (i.e., 5 mg/ml) of MgO NPs shows highest toxicity to the RBCs in comparison to the comparatively higher concentration (i.e., 15
and 25 mg/ml) of MgO NPs. Relatively lower cytotoxicity to the RBCs was observed
at the concentration of 25 mg/ml MgO NPs.
In the present study, RBCs cytotoxicity was measured by both spectrophotometric
analysis and microscopic observation. Table 1 shows the measurement of concentration of hemoglobin released by the RBCs upon incubation with MgO NPs. More
the concentration of hemoglobin in the solution implies more absorbance shown
by the spectrophotometric measurement reflecting more damage to the RBCs, thus