

174
A. Sultana and U. Ghosh
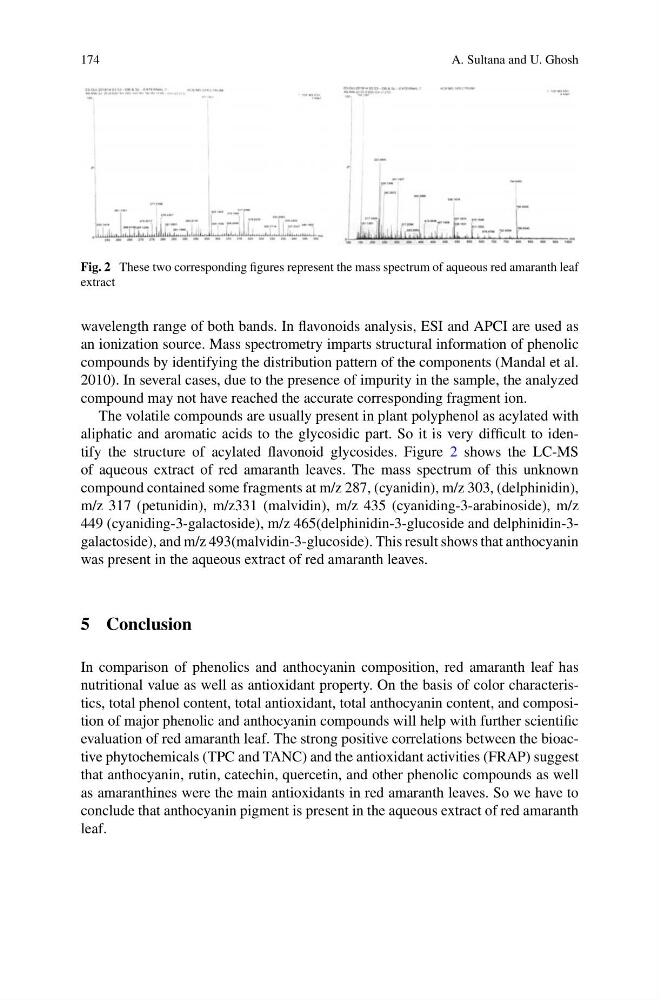
Fig. 2 These two corresponding figures represent the mass spectrum of aqueous red amaranth leaf
extract
wavelength range of both bands. In flavonoids analysis, ESI and APCI are used as
an ionization source. Mass spectrometry imparts structural information of phenolic
compounds by identifying the distribution pattern of the components (Mandal et al.
2010). In several cases, due to the presence of impurity in the sample, the analyzed
compound may not have reached the accurate corresponding fragment ion.
The volatile compounds are usually present in plant polyphenol as acylated with
aliphatic and aromatic acids to the glycosidic part. So it is very difficult to identify the structure of acylated flavonoid glycosides. Figure 2 shows the LC-MS
of aqueous extract of red amaranth leaves. The mass spectrum of this unknown
compound contained some fragments at m/z 287, (cyanidin), m/z 303, (delphinidin),
m/z 317 (petunidin), m/z331 (malvidin), m/z 435 (cyaniding-3-arabinoside), m/z
449 (cyaniding-3-galactoside), m/z 465(delphinidin-3-glucoside and delphinidin-3galactoside), and m/z 493(malvidin-3-glucoside). This result shows that anthocyanin
was present in the aqueous extract of red amaranth leaves.
5 Conclusion
In comparison of phenolics and anthocyanin composition, red amaranth leaf has
nutritional value as well as antioxidant property. On the basis of color characteristics, total phenol content, total antioxidant, total anthocyanin content, and composition of major phenolic and anthocyanin compounds will help with further scientific
evaluation of red amaranth leaf. The strong positive correlations between the bioactive phytochemicals (TPC and TANC) and the antioxidant activities (FRAP) suggest
that anthocyanin, rutin, catechin, quercetin, and other phenolic compounds as well
as amaranthines were the main antioxidants in red amaranth leaves. So we have to
conclude that anthocyanin pigment is present in the aqueous extract of red amaranth
leaf.
A. Sultana and U. Ghosh
Fig. 2 These two corresponding figures represent the mass spectrum of aqueous red amaranth leaf
extract
wavelength range of both bands. In flavonoids analysis, ESI and APCI are used as
an ionization source. Mass spectrometry imparts structural information of phenolic
compounds by identifying the distribution pattern of the components (Mandal et al.
2010). In several cases, due to the presence of impurity in the sample, the analyzed
compound may not have reached the accurate corresponding fragment ion.
The volatile compounds are usually present in plant polyphenol as acylated with
aliphatic and aromatic acids to the glycosidic part. So it is very difficult to identify the structure of acylated flavonoid glycosides. Figure 2 shows the LC-MS
of aqueous extract of red amaranth leaves. The mass spectrum of this unknown
compound contained some fragments at m/z 287, (cyanidin), m/z 303, (delphinidin),
m/z 317 (petunidin), m/z331 (malvidin), m/z 435 (cyaniding-3-arabinoside), m/z
449 (cyaniding-3-galactoside), m/z 465(delphinidin-3-glucoside and delphinidin-3galactoside), and m/z 493(malvidin-3-glucoside). This result shows that anthocyanin
was present in the aqueous extract of red amaranth leaves.
5 Conclusion
In comparison of phenolics and anthocyanin composition, red amaranth leaf has
nutritional value as well as antioxidant property. On the basis of color characteristics, total phenol content, total antioxidant, total anthocyanin content, and composition of major phenolic and anthocyanin compounds will help with further scientific
evaluation of red amaranth leaf. The strong positive correlations between the bioactive phytochemicals (TPC and TANC) and the antioxidant activities (FRAP) suggest
that anthocyanin, rutin, catechin, quercetin, and other phenolic compounds as well
as amaranthines were the main antioxidants in red amaranth leaves. So we have to
conclude that anthocyanin pigment is present in the aqueous extract of red amaranth
leaf.