

Identification of Aqueous Extract of Red Amaranth …
173
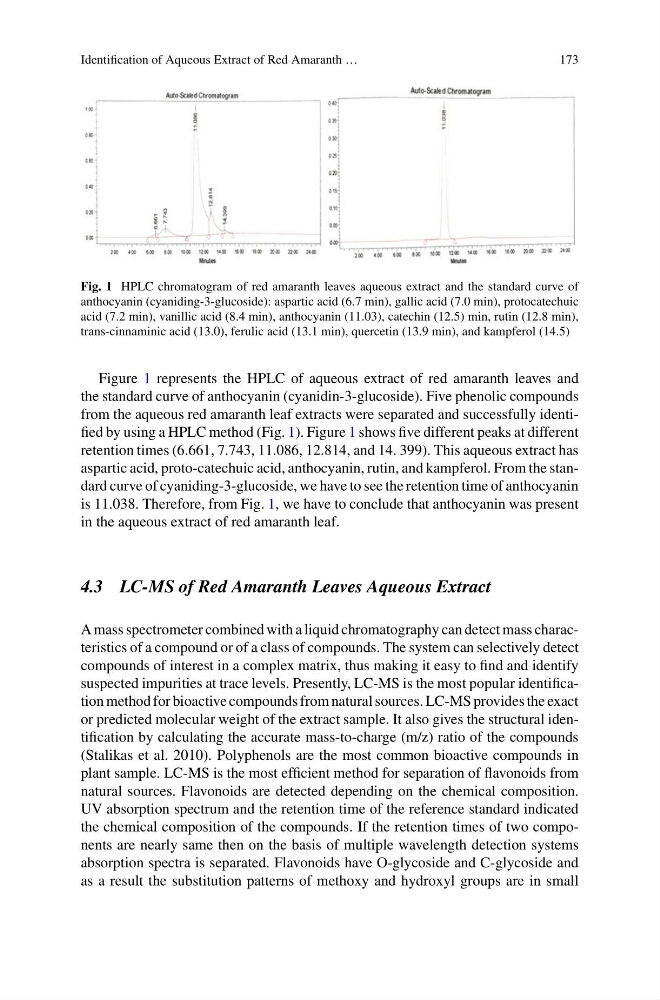
Fig. 1 HPLC chromatogram of red amaranth leaves aqueous extract and the standard curve of
anthocyanin (cyaniding-3-glucoside): aspartic acid (6.7 min), gallic acid (7.0 min), protocatechuic
acid (7.2 min), vanillic acid (8.4 min), anthocyanin (11.03), catechin (12.5) min, rutin (12.8 min),
trans-cinnaminic acid (13.0), ferulic acid (13.1 min), quercetin (13.9 min), and kampferol (14.5)
Figure 1 represents the HPLC of aqueous extract of red amaranth leaves and
the standard curve of anthocyanin (cyanidin-3-glucoside). Five phenolic compounds
from the aqueous red amaranth leaf extracts were separated and successfully identified by using a HPLC method (Fig. 1). Figure 1 shows five different peaks at different
retention times (6.661, 7.743, 11.086, 12.814, and 14. 399). This aqueous extract has
aspartic acid, proto-catechuic acid, anthocyanin, rutin, and kampferol. From the standard curve of cyaniding-3-glucoside, we have to see the retention time of anthocyanin
is 11.038. Therefore, from Fig. 1, we have to conclude that anthocyanin was present
in the aqueous extract of red amaranth leaf.
4.3 LC-MS of Red Amaranth Leaves Aqueous Extract
A mass spectrometer combined with a liquid chromatography can detect mass characteristics of a compound or of a class of compounds. The system can selectively detect
compounds of interest in a complex matrix, thus making it easy to find and identify
suspected impurities at trace levels. Presently, LC-MS is the most popular identification method for bioactive compounds from natural sources. LC-MS provides the exact
or predicted molecular weight of the extract sample. It also gives the structural identification by calculating the accurate mass-to-charge (m/z) ratio of the compounds
(Stalikas et al. 2010). Polyphenols are the most common bioactive compounds in
plant sample. LC-MS is the most efficient method for separation of flavonoids from
natural sources. Flavonoids are detected depending on the chemical composition.
UV absorption spectrum and the retention time of the reference standard indicated
the chemical composition of the compounds. If the retention times of two components are nearly same then on the basis of multiple wavelength detection systems
absorption spectra is separated. Flavonoids have O-glycoside and C-glycoside and
as a result the substitution patterns of methoxy and hydroxyl groups are in small
173
Fig. 1 HPLC chromatogram of red amaranth leaves aqueous extract and the standard curve of
anthocyanin (cyaniding-3-glucoside): aspartic acid (6.7 min), gallic acid (7.0 min), protocatechuic
acid (7.2 min), vanillic acid (8.4 min), anthocyanin (11.03), catechin (12.5) min, rutin (12.8 min),
trans-cinnaminic acid (13.0), ferulic acid (13.1 min), quercetin (13.9 min), and kampferol (14.5)
Figure 1 represents the HPLC of aqueous extract of red amaranth leaves and
the standard curve of anthocyanin (cyanidin-3-glucoside). Five phenolic compounds
from the aqueous red amaranth leaf extracts were separated and successfully identified by using a HPLC method (Fig. 1). Figure 1 shows five different peaks at different
retention times (6.661, 7.743, 11.086, 12.814, and 14. 399). This aqueous extract has
aspartic acid, proto-catechuic acid, anthocyanin, rutin, and kampferol. From the standard curve of cyaniding-3-glucoside, we have to see the retention time of anthocyanin
is 11.038. Therefore, from Fig. 1, we have to conclude that anthocyanin was present
in the aqueous extract of red amaranth leaf.
4.3 LC-MS of Red Amaranth Leaves Aqueous Extract
A mass spectrometer combined with a liquid chromatography can detect mass characteristics of a compound or of a class of compounds. The system can selectively detect
compounds of interest in a complex matrix, thus making it easy to find and identify
suspected impurities at trace levels. Presently, LC-MS is the most popular identification method for bioactive compounds from natural sources. LC-MS provides the exact
or predicted molecular weight of the extract sample. It also gives the structural identification by calculating the accurate mass-to-charge (m/z) ratio of the compounds
(Stalikas et al. 2010). Polyphenols are the most common bioactive compounds in
plant sample. LC-MS is the most efficient method for separation of flavonoids from
natural sources. Flavonoids are detected depending on the chemical composition.
UV absorption spectrum and the retention time of the reference standard indicated
the chemical composition of the compounds. If the retention times of two components are nearly same then on the basis of multiple wavelength detection systems
absorption spectra is separated. Flavonoids have O-glycoside and C-glycoside and
as a result the substitution patterns of methoxy and hydroxyl groups are in small