

172
A. Sultana and U. Ghosh
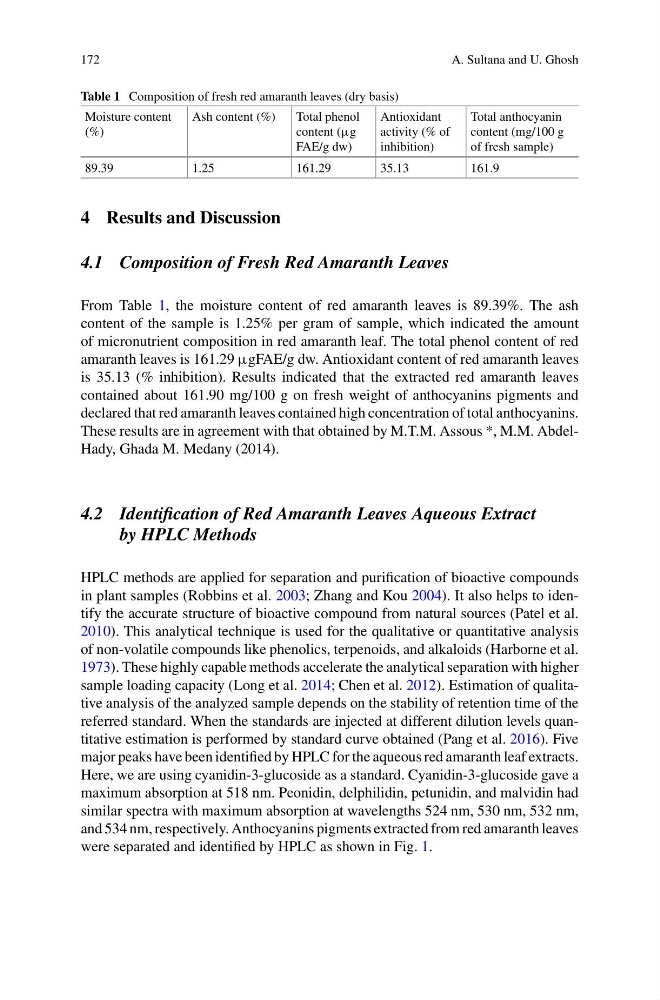
Table 1 Composition of fresh red amaranth leaves (dry basis)
Moisture content
(%)
Ash content (%)
Total phenol
content (μg
FAE/g dw)
Antioxidant
activity (% of
inhibition)
Total anthocyanin
content (mg/100 g
of fresh sample)
89.39
1.25
161.29
35.13
161.9
4 Results and Discussion
4.1 Composition of Fresh Red Amaranth Leaves
From Table 1, the moisture content of red amaranth leaves is 89.39%. The ash
content of the sample is 1.25% per gram of sample, which indicated the amount
of micronutrient composition in red amaranth leaf. The total phenol content of red
amaranth leaves is 161.29 μgFAE/g dw. Antioxidant content of red amaranth leaves
is 35.13 (% inhibition). Results indicated that the extracted red amaranth leaves
contained about 161.90 mg/100 g on fresh weight of anthocyanins pigments and
declared that red amaranth leaves contained high concentration of total anthocyanins.
These results are in agreement with that obtained by M.T.M. Assous *, M.M. AbdelHady, Ghada M. Medany (2014).
4.2 Identification of Red Amaranth Leaves Aqueous Extract
by HPLC Methods
HPLC methods are applied for separation and purification of bioactive compounds
in plant samples (Robbins et al. 2003; Zhang and Kou 2004). It also helps to identify the accurate structure of bioactive compound from natural sources (Patel et al.
2010). This analytical technique is used for the qualitative or quantitative analysis
of non-volatile compounds like phenolics, terpenoids, and alkaloids (Harborne et al.
1973). These highly capable methods accelerate the analytical separation with higher
sample loading capacity (Long et al. 2014; Chen et al. 2012). Estimation of qualitative analysis of the analyzed sample depends on the stability of retention time of the
referred standard. When the standards are injected at different dilution levels quantitative estimation is performed by standard curve obtained (Pang et al. 2016). Five
major peaks have been identified by HPLC for the aqueous red amaranth leaf extracts.
Here, we are using cyanidin-3-glucoside as a standard. Cyanidin-3-glucoside gave a
maximum absorption at 518 nm. Peonidin, delphilidin, petunidin, and malvidin had
similar spectra with maximum absorption at wavelengths 524 nm, 530 nm, 532 nm,
and 534 nm, respectively. Anthocyanins pigments extracted from red amaranth leaves
were separated and identified by HPLC as shown in Fig. 1.
A. Sultana and U. Ghosh
Table 1 Composition of fresh red amaranth leaves (dry basis)
Moisture content
(%)
Ash content (%)
Total phenol
content (μg
FAE/g dw)
Antioxidant
activity (% of
inhibition)
Total anthocyanin
content (mg/100 g
of fresh sample)
89.39
1.25
161.29
35.13
161.9
4 Results and Discussion
4.1 Composition of Fresh Red Amaranth Leaves
From Table 1, the moisture content of red amaranth leaves is 89.39%. The ash
content of the sample is 1.25% per gram of sample, which indicated the amount
of micronutrient composition in red amaranth leaf. The total phenol content of red
amaranth leaves is 161.29 μgFAE/g dw. Antioxidant content of red amaranth leaves
is 35.13 (% inhibition). Results indicated that the extracted red amaranth leaves
contained about 161.90 mg/100 g on fresh weight of anthocyanins pigments and
declared that red amaranth leaves contained high concentration of total anthocyanins.
These results are in agreement with that obtained by M.T.M. Assous *, M.M. AbdelHady, Ghada M. Medany (2014).
4.2 Identification of Red Amaranth Leaves Aqueous Extract
by HPLC Methods
HPLC methods are applied for separation and purification of bioactive compounds
in plant samples (Robbins et al. 2003; Zhang and Kou 2004). It also helps to identify the accurate structure of bioactive compound from natural sources (Patel et al.
2010). This analytical technique is used for the qualitative or quantitative analysis
of non-volatile compounds like phenolics, terpenoids, and alkaloids (Harborne et al.
1973). These highly capable methods accelerate the analytical separation with higher
sample loading capacity (Long et al. 2014; Chen et al. 2012). Estimation of qualitative analysis of the analyzed sample depends on the stability of retention time of the
referred standard. When the standards are injected at different dilution levels quantitative estimation is performed by standard curve obtained (Pang et al. 2016). Five
major peaks have been identified by HPLC for the aqueous red amaranth leaf extracts.
Here, we are using cyanidin-3-glucoside as a standard. Cyanidin-3-glucoside gave a
maximum absorption at 518 nm. Peonidin, delphilidin, petunidin, and malvidin had
similar spectra with maximum absorption at wavelengths 524 nm, 530 nm, 532 nm,
and 534 nm, respectively. Anthocyanins pigments extracted from red amaranth leaves
were separated and identified by HPLC as shown in Fig. 1.