

116
P. Ghosh and U. Ghosh
Y = +85.94 + 2.01A − 1.02B + 2.72C + 1.92D
− 2.08AB − 0.28AC − 0.32 AD − 4.05BC − 5.39B D
− 3.07C D − 41.69A
2
− 16.88B
2
− 12.72C
2
− 8.14D
2
where Y is the predicted yield of dye decolorization; A, B, C, D are the coded values of
dye concentration (mM), enzyme concentration (U/ml), pH, HBT (%), respectively.
The analysis of variance (ANOVA) was conducted to test the significance of the fit of
the second-order polynomial equation for the experimental data as shown in Table 2.
The Model F-value of 1054.38 implies the model is significant. There is only a
0.01% chance that a “Model F-value” could occur due to noise. Model P-value in this
study was <0.0001 which also indicates that the model was significant. The coefficient
of variation (R
2
= 0.999) indicates a good agreement between experimental and
predicted values, which implies that the model was reliable for dye decolorization
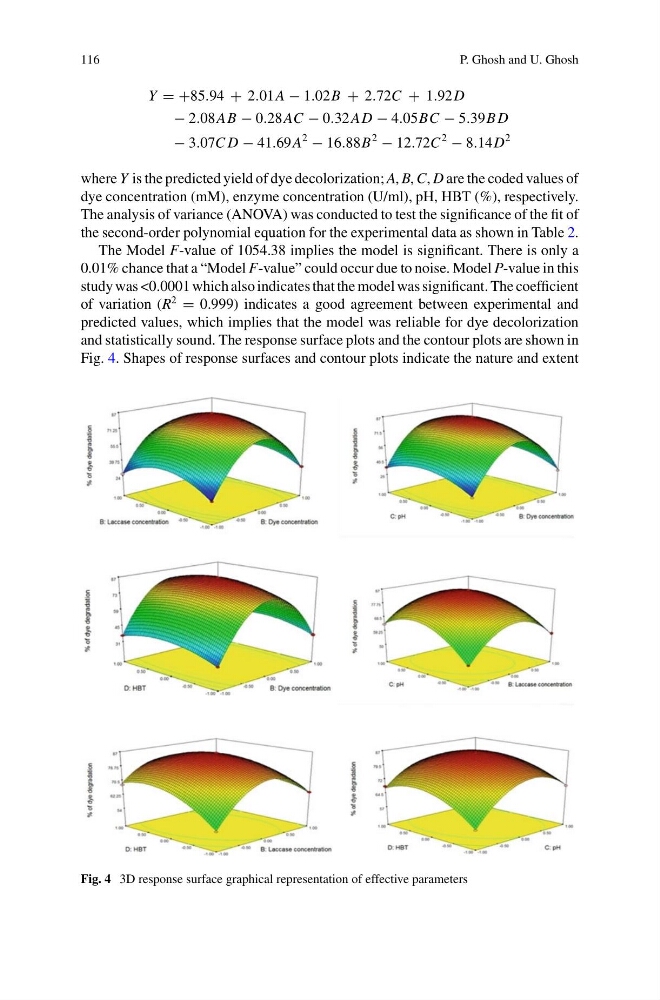
and statistically sound. The response surface plots and the contour plots are shown in
Fig. 4. Shapes of response surfaces and contour plots indicate the nature and extent
Fig. 4 3D response surface graphical representation of effective parameters
P. Ghosh and U. Ghosh
Y = +85.94 + 2.01A − 1.02B + 2.72C + 1.92D
− 2.08AB − 0.28AC − 0.32 AD − 4.05BC − 5.39B D
− 3.07C D − 41.69A
2
− 16.88B
2
− 12.72C
2
− 8.14D
2
where Y is the predicted yield of dye decolorization; A, B, C, D are the coded values of
dye concentration (mM), enzyme concentration (U/ml), pH, HBT (%), respectively.
The analysis of variance (ANOVA) was conducted to test the significance of the fit of
the second-order polynomial equation for the experimental data as shown in Table 2.
The Model F-value of 1054.38 implies the model is significant. There is only a
0.01% chance that a “Model F-value” could occur due to noise. Model P-value in this
study was <0.0001 which also indicates that the model was significant. The coefficient
of variation (R
2
= 0.999) indicates a good agreement between experimental and
predicted values, which implies that the model was reliable for dye decolorization
and statistically sound. The response surface plots and the contour plots are shown in
Fig. 4. Shapes of response surfaces and contour plots indicate the nature and extent
Fig. 4 3D response surface graphical representation of effective parameters