

Understanding the Mechanical Response of Friction Stir Welded …
49
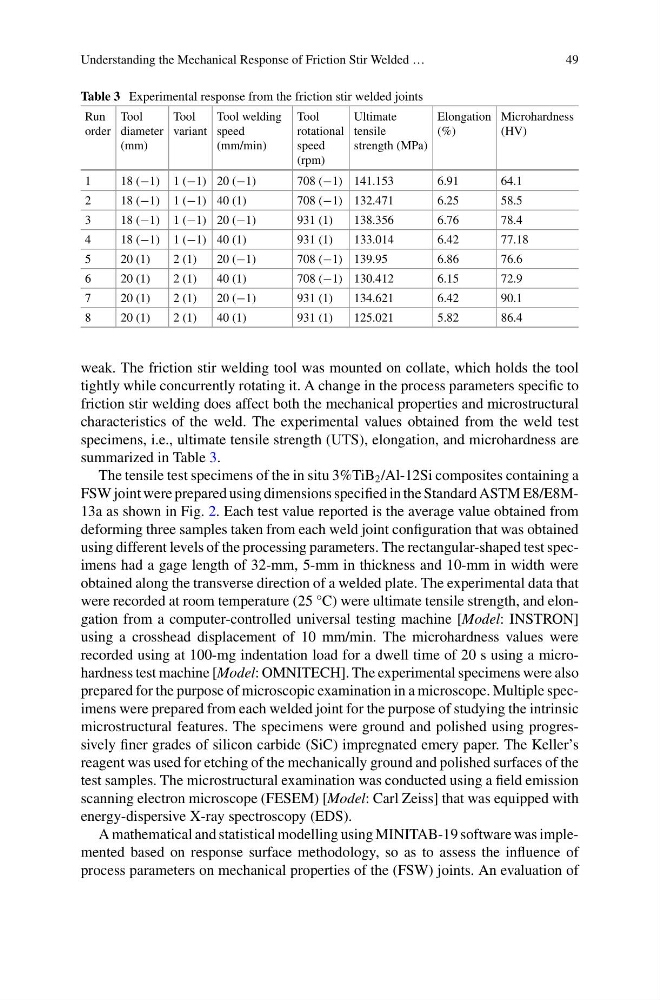
Table 3 Experimental response from the friction stir welded joints
Run
order
Tool
diameter
(mm)
Tool
variant
Tool welding
speed
(mm/min)
Tool
rotational
speed
(rpm)
Ultimate
tensile
strength (MPa)
Elongation
(%)
Microhardness
(HV)
1
18 (−1) 1 (−1) 20 (−1)
708 (−1) 141.153
6.91
64.1
2
18 (−1) 1 (−1) 40 (1)
708 (−1) 132.471
6.25
58.5
3
18 (−1) 1 (−1) 20 (−1)
931 (1)
138.356
6.76
78.4
4
18 (−1) 1 (−1) 40 (1)
931 (1)
133.014
6.42
77.18
5
20 (1)
2 (1)
20 (−1)
708 (−1) 139.95
6.86
76.6
6
20 (1)
2 (1)
40 (1)
708 (−1) 130.412
6.15
72.9
7
20 (1)
2 (1)
20 (−1)
931 (1)
134.621
6.42
90.1
8
20 (1)
2 (1)
40 (1)
931 (1)
125.021
5.82
86.4
weak. The friction stir welding tool was mounted on collate, which holds the tool
tightly while concurrently rotating it. A change in the process parameters specific to
friction stir welding does affect both the mechanical properties and microstructural
characteristics of the weld. The experimental values obtained from the weld test
specimens, i.e., ultimate tensile strength (UTS), elongation, and microhardness are
summarized in Table 3.
The tensile test specimens of the in situ 3%TiB 2 /Al-12Si composites containing a
FSW joint were prepared using dimensions specified in the Standard ASTM E8/E8M13a as shown in Fig. 2. Each test value reported is the average value obtained from
deforming three samples taken from each weld joint configuration that was obtained
using different levels of the processing parameters. The rectangular-shaped test specimens had a gage length of 32-mm, 5-mm in thickness and 10-mm in width were
obtained along the transverse direction of a welded plate. The experimental data that
were recorded at room temperature (25 °C) were ultimate tensile strength, and elongation from a computer-controlled universal testing machine [Model: INSTRON]
using a crosshead displacement of 10 mm/min. The microhardness values were
recorded using at 100-mg indentation load for a dwell time of 20 s using a microhardness test machine [Model: OMNITECH]. The experimental specimens were also
prepared for the purpose of microscopic examination in a microscope. Multiple specimens were prepared from each welded joint for the purpose of studying the intrinsic
microstructural features. The specimens were ground and polished using progressively finer grades of silicon carbide (SiC) impregnated emery paper. The Keller’s
reagent was used for etching of the mechanically ground and polished surfaces of the
test samples. The microstructural examination was conducted using a field emission
scanning electron microscope (FESEM) [Model: Carl Zeiss] that was equipped with
energy-dispersive X-ray spectroscopy (EDS).
A mathematical and statistical modelling using MINITAB-19 software was implemented based on response surface methodology, so as to assess the influence of
process parameters on mechanical properties of the (FSW) joints. An evaluation of
49
Table 3 Experimental response from the friction stir welded joints
Run
order
Tool
diameter
(mm)
Tool
variant
Tool welding
speed
(mm/min)
Tool
rotational
speed
(rpm)
Ultimate
tensile
strength (MPa)
Elongation
(%)
Microhardness
(HV)
1
18 (−1) 1 (−1) 20 (−1)
708 (−1) 141.153
6.91
64.1
2
18 (−1) 1 (−1) 40 (1)
708 (−1) 132.471
6.25
58.5
3
18 (−1) 1 (−1) 20 (−1)
931 (1)
138.356
6.76
78.4
4
18 (−1) 1 (−1) 40 (1)
931 (1)
133.014
6.42
77.18
5
20 (1)
2 (1)
20 (−1)
708 (−1) 139.95
6.86
76.6
6
20 (1)
2 (1)
40 (1)
708 (−1) 130.412
6.15
72.9
7
20 (1)
2 (1)
20 (−1)
931 (1)
134.621
6.42
90.1
8
20 (1)
2 (1)
40 (1)
931 (1)
125.021
5.82
86.4
weak. The friction stir welding tool was mounted on collate, which holds the tool
tightly while concurrently rotating it. A change in the process parameters specific to
friction stir welding does affect both the mechanical properties and microstructural
characteristics of the weld. The experimental values obtained from the weld test
specimens, i.e., ultimate tensile strength (UTS), elongation, and microhardness are
summarized in Table 3.
The tensile test specimens of the in situ 3%TiB 2 /Al-12Si composites containing a
FSW joint were prepared using dimensions specified in the Standard ASTM E8/E8M13a as shown in Fig. 2. Each test value reported is the average value obtained from
deforming three samples taken from each weld joint configuration that was obtained
using different levels of the processing parameters. The rectangular-shaped test specimens had a gage length of 32-mm, 5-mm in thickness and 10-mm in width were
obtained along the transverse direction of a welded plate. The experimental data that
were recorded at room temperature (25 °C) were ultimate tensile strength, and elongation from a computer-controlled universal testing machine [Model: INSTRON]
using a crosshead displacement of 10 mm/min. The microhardness values were
recorded using at 100-mg indentation load for a dwell time of 20 s using a microhardness test machine [Model: OMNITECH]. The experimental specimens were also
prepared for the purpose of microscopic examination in a microscope. Multiple specimens were prepared from each welded joint for the purpose of studying the intrinsic
microstructural features. The specimens were ground and polished using progressively finer grades of silicon carbide (SiC) impregnated emery paper. The Keller’s
reagent was used for etching of the mechanically ground and polished surfaces of the
test samples. The microstructural examination was conducted using a field emission
scanning electron microscope (FESEM) [Model: Carl Zeiss] that was equipped with
energy-dispersive X-ray spectroscopy (EDS).
A mathematical and statistical modelling using MINITAB-19 software was implemented based on response surface methodology, so as to assess the influence of
process parameters on mechanical properties of the (FSW) joints. An evaluation of