

234
A. Gupta and C. Srivastava
governed by the bulkiness of the ionic species. In mathematical terms, for 3D i-nu ,
A/N 0 → ∞ and for 3D p-nu , A/N 0 → 0.
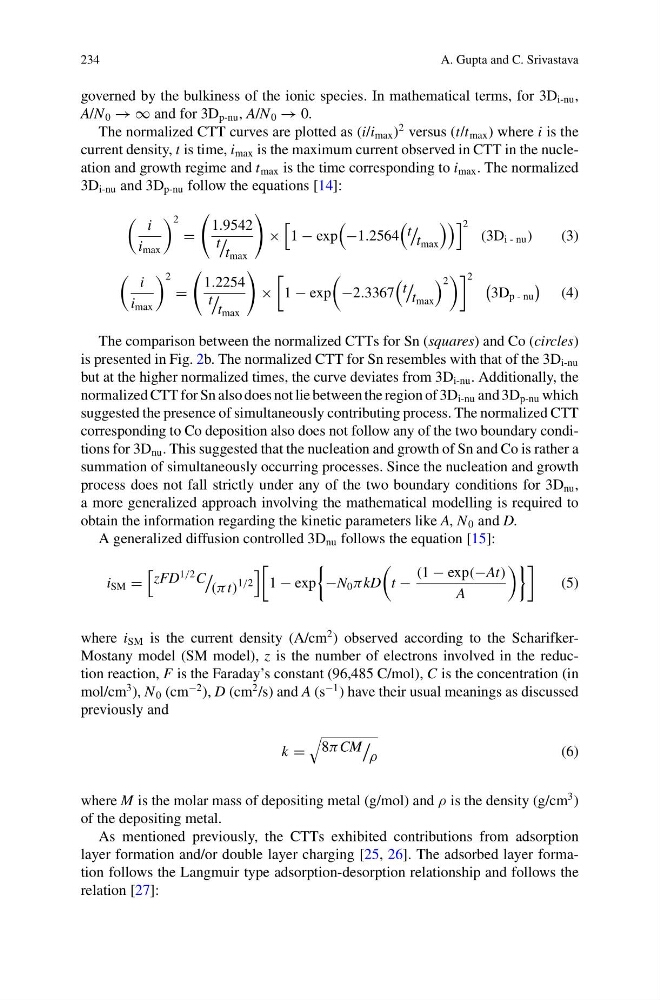
The normalized CTT curves are plotted as (i/i max )
2 versus (t/t max ) where i is the
current density, t is time, i max is the maximum current observed in CTT in the nucleation and growth regime and t max is the time corresponding to i max . The normalized
3D i-nu and 3D p-nu follow the equations [14]:
i
i max
2
=
1.9542
t
t max
×
1 − exp
−1.2564
t
t max
2 (3D i - nu )
(3)
i
i max
2
=
1.2254
t
t max
×
1 − exp
−2.3367
t
t max
2
2
3D p - nu
(4)
The comparison between the normalized CTTs for Sn (squares) and Co (circles)
is presented in Fig. 2b. The normalized CTT for Sn resembles with that of the 3D i-nu
but at the higher normalized times, the curve deviates from 3D i-nu . Additionally, the
normalized CTT for Sn also does not lie between the region of 3D i-nu and 3D p-nu which
suggested the presence of simultaneously contributing process. The normalized CTT
corresponding to Co deposition also does not follow any of the two boundary conditions for 3D nu . This suggested that the nucleation and growth of Sn and Co is rather a
summation of simultaneously occurring processes. Since the nucleation and growth
process does not fall strictly under any of the two boundary conditions for 3D nu ,
a more generalized approach involving the mathematical modelling is required to
obtain the information regarding the kinetic parameters like A, N 0 and D.
A generalized diffusion controlled 3D nu follows the equation [15]:
i SM =
zFD
1/2 C
(π t)
1/2
1 − exp
−N 0 π kD
t −
(1 − exp(−At)
A
(5)
where i SM is the current density (A/cm
2 ) observed according to the ScharifkerMostany model (SM model), z is the number of electrons involved in the reduction reaction, F is the Faraday’s constant (96,485 C/mol), C is the concentration (in
mol/cm
3 ), N 0 (cm
−2 ), D (cm
2 /s) and A (s
−1 ) have their usual meanings as discussed
previously and
k =
8π CM
ρ
(6)
where M is the molar mass of depositing metal (g/mol) and ρ is the density (g/cm
3 )
of the depositing metal.
As mentioned previously, the CTTs exhibited contributions from adsorption
layer formation and/or double layer charging [25, 26]. The adsorbed layer formation follows the Langmuir type adsorption-desorption relationship and follows the
relation [27]:
A. Gupta and C. Srivastava
governed by the bulkiness of the ionic species. In mathematical terms, for 3D i-nu ,
A/N 0 → ∞ and for 3D p-nu , A/N 0 → 0.
The normalized CTT curves are plotted as (i/i max )
2 versus (t/t max ) where i is the
current density, t is time, i max is the maximum current observed in CTT in the nucleation and growth regime and t max is the time corresponding to i max . The normalized
3D i-nu and 3D p-nu follow the equations [14]:
i
i max
2
=
1.9542
t
t max
×
1 − exp
−1.2564
t
t max
2 (3D i - nu )
(3)
i
i max
2
=
1.2254
t
t max
×
1 − exp
−2.3367
t
t max
2
2
3D p - nu
(4)
The comparison between the normalized CTTs for Sn (squares) and Co (circles)
is presented in Fig. 2b. The normalized CTT for Sn resembles with that of the 3D i-nu
but at the higher normalized times, the curve deviates from 3D i-nu . Additionally, the
normalized CTT for Sn also does not lie between the region of 3D i-nu and 3D p-nu which
suggested the presence of simultaneously contributing process. The normalized CTT
corresponding to Co deposition also does not follow any of the two boundary conditions for 3D nu . This suggested that the nucleation and growth of Sn and Co is rather a
summation of simultaneously occurring processes. Since the nucleation and growth
process does not fall strictly under any of the two boundary conditions for 3D nu ,
a more generalized approach involving the mathematical modelling is required to
obtain the information regarding the kinetic parameters like A, N 0 and D.
A generalized diffusion controlled 3D nu follows the equation [15]:
i SM =
zFD
1/2 C
(π t)
1/2
1 − exp
−N 0 π kD
t −
(1 − exp(−At)
A
(5)
where i SM is the current density (A/cm
2 ) observed according to the ScharifkerMostany model (SM model), z is the number of electrons involved in the reduction reaction, F is the Faraday’s constant (96,485 C/mol), C is the concentration (in
mol/cm
3 ), N 0 (cm
−2 ), D (cm
2 /s) and A (s
−1 ) have their usual meanings as discussed
previously and
k =
8π CM
ρ
(6)
where M is the molar mass of depositing metal (g/mol) and ρ is the density (g/cm
3 )
of the depositing metal.
As mentioned previously, the CTTs exhibited contributions from adsorption
layer formation and/or double layer charging [25, 26]. The adsorbed layer formation follows the Langmuir type adsorption-desorption relationship and follows the
relation [27]: