

Kinetics and Thermodynamics of Metal Cluster Nucleation …
233
Chronoamperometry
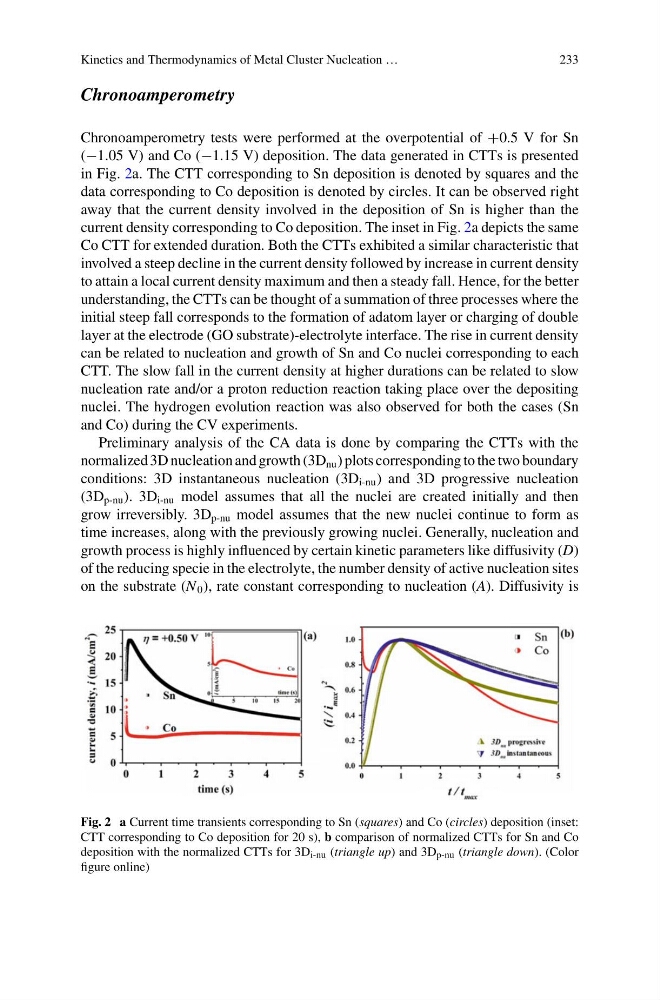
Chronoamperometry tests were performed at the overpotential of +0.5 V for Sn
(−1.05 V) and Co (−1.15 V) deposition. The data generated in CTTs is presented
in Fig. 2a. The CTT corresponding to Sn deposition is denoted by squares and the
data corresponding to Co deposition is denoted by circles. It can be observed right
away that the current density involved in the deposition of Sn is higher than the
current density corresponding to Co deposition. The inset in Fig. 2a depicts the same
Co CTT for extended duration. Both the CTTs exhibited a similar characteristic that
involved a steep decline in the current density followed by increase in current density
to attain a local current density maximum and then a steady fall. Hence, for the better
understanding, the CTTs can be thought of a summation of three processes where the
initial steep fall corresponds to the formation of adatom layer or charging of double
layer at the electrode (GO substrate)-electrolyte interface. The rise in current density
can be related to nucleation and growth of Sn and Co nuclei corresponding to each
CTT. The slow fall in the current density at higher durations can be related to slow
nucleation rate and/or a proton reduction reaction taking place over the depositing
nuclei. The hydrogen evolution reaction was also observed for both the cases (Sn
and Co) during the CV experiments.
Preliminary analysis of the CA data is done by comparing the CTTs with the
normalized 3D nucleation and growth (3D nu ) plots corresponding to the two boundary
conditions: 3D instantaneous nucleation (3D i-nu ) and 3D progressive nucleation
(3D p-nu ). 3D i-nu model assumes that all the nuclei are created initially and then
grow irreversibly. 3D p-nu model assumes that the new nuclei continue to form as
time increases, along with the previously growing nuclei. Generally, nucleation and
growth process is highly influenced by certain kinetic parameters like diffusivity (D)
of the reducing specie in the electrolyte, the number density of active nucleation sites
on the substrate (N 0 ), rate constant corresponding to nucleation (A). Diffusivity is
Fig. 2 a Current time transients corresponding to Sn (squares) and Co (circles) deposition (inset:
CTT corresponding to Co deposition for 20 s), b comparison of normalized CTTs for Sn and Co
deposition with the normalized CTTs for 3D i-nu (triangle up) and 3D p-nu (triangle down). (Color
figure online)
233
Chronoamperometry
Chronoamperometry tests were performed at the overpotential of +0.5 V for Sn
(−1.05 V) and Co (−1.15 V) deposition. The data generated in CTTs is presented
in Fig. 2a. The CTT corresponding to Sn deposition is denoted by squares and the
data corresponding to Co deposition is denoted by circles. It can be observed right
away that the current density involved in the deposition of Sn is higher than the
current density corresponding to Co deposition. The inset in Fig. 2a depicts the same
Co CTT for extended duration. Both the CTTs exhibited a similar characteristic that
involved a steep decline in the current density followed by increase in current density
to attain a local current density maximum and then a steady fall. Hence, for the better
understanding, the CTTs can be thought of a summation of three processes where the
initial steep fall corresponds to the formation of adatom layer or charging of double
layer at the electrode (GO substrate)-electrolyte interface. The rise in current density
can be related to nucleation and growth of Sn and Co nuclei corresponding to each
CTT. The slow fall in the current density at higher durations can be related to slow
nucleation rate and/or a proton reduction reaction taking place over the depositing
nuclei. The hydrogen evolution reaction was also observed for both the cases (Sn
and Co) during the CV experiments.
Preliminary analysis of the CA data is done by comparing the CTTs with the
normalized 3D nucleation and growth (3D nu ) plots corresponding to the two boundary
conditions: 3D instantaneous nucleation (3D i-nu ) and 3D progressive nucleation
(3D p-nu ). 3D i-nu model assumes that all the nuclei are created initially and then
grow irreversibly. 3D p-nu model assumes that the new nuclei continue to form as
time increases, along with the previously growing nuclei. Generally, nucleation and
growth process is highly influenced by certain kinetic parameters like diffusivity (D)
of the reducing specie in the electrolyte, the number density of active nucleation sites
on the substrate (N 0 ), rate constant corresponding to nucleation (A). Diffusivity is
Fig. 2 a Current time transients corresponding to Sn (squares) and Co (circles) deposition (inset:
CTT corresponding to Co deposition for 20 s), b comparison of normalized CTTs for Sn and Co
deposition with the normalized CTTs for 3D i-nu (triangle up) and 3D p-nu (triangle down). (Color
figure online)