

196
K. A. S. Fessler et al.
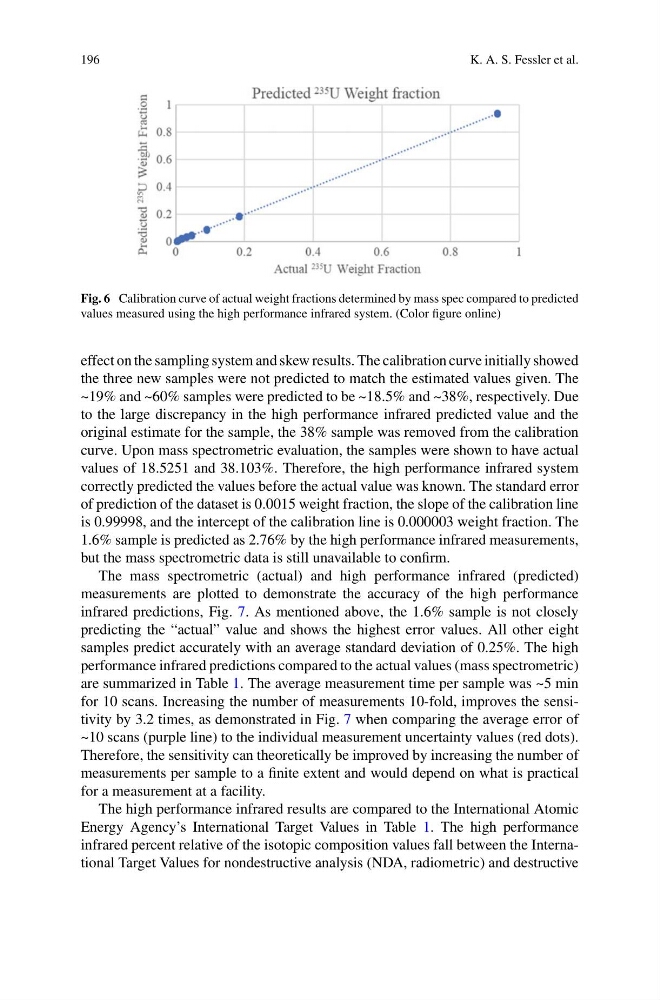
Fig. 6 Calibration curve of actual weight fractions determined by mass spec compared to predicted
values measured using the high performance infrared system. (Color figure online)
effect on the sampling system and skew results. The calibration curve initially showed
the three new samples were not predicted to match the estimated values given. The
~19% and ~60% samples were predicted to be ~18.5% and ~38%, respectively. Due
to the large discrepancy in the high performance infrared predicted value and the
original estimate for the sample, the 38% sample was removed from the calibration
curve. Upon mass spectrometric evaluation, the samples were shown to have actual
values of 18.5251 and 38.103%. Therefore, the high performance infrared system
correctly predicted the values before the actual value was known. The standard error
of prediction of the dataset is 0.0015 weight fraction, the slope of the calibration line
is 0.99998, and the intercept of the calibration line is 0.000003 weight fraction. The
1.6% sample is predicted as 2.76% by the high performance infrared measurements,
but the mass spectrometric data is still unavailable to confirm.
The mass spectrometric (actual) and high performance infrared (predicted)
measurements are plotted to demonstrate the accuracy of the high performance
infrared predictions, Fig. 7. As mentioned above, the 1.6% sample is not closely
predicting the “actual” value and shows the highest error values. All other eight
samples predict accurately with an average standard deviation of 0.25%. The high
performance infrared predictions compared to the actual values (mass spectrometric)
are summarized in Table 1. The average measurement time per sample was ~5 min
for 10 scans. Increasing the number of measurements 10-fold, improves the sensitivity by 3.2 times, as demonstrated in Fig. 7 when comparing the average error of
~10 scans (purple line) to the individual measurement uncertainty values (red dots).
Therefore, the sensitivity can theoretically be improved by increasing the number of
measurements per sample to a finite extent and would depend on what is practical
for a measurement at a facility.
The high performance infrared results are compared to the International Atomic
Energy Agency’s International Target Values in Table 1. The high performance
infrared percent relative of the isotopic composition values fall between the International Target Values for nondestructive analysis (NDA, radiometric) and destructive
K. A. S. Fessler et al.
Fig. 6 Calibration curve of actual weight fractions determined by mass spec compared to predicted
values measured using the high performance infrared system. (Color figure online)
effect on the sampling system and skew results. The calibration curve initially showed
the three new samples were not predicted to match the estimated values given. The
~19% and ~60% samples were predicted to be ~18.5% and ~38%, respectively. Due
to the large discrepancy in the high performance infrared predicted value and the
original estimate for the sample, the 38% sample was removed from the calibration
curve. Upon mass spectrometric evaluation, the samples were shown to have actual
values of 18.5251 and 38.103%. Therefore, the high performance infrared system
correctly predicted the values before the actual value was known. The standard error
of prediction of the dataset is 0.0015 weight fraction, the slope of the calibration line
is 0.99998, and the intercept of the calibration line is 0.000003 weight fraction. The
1.6% sample is predicted as 2.76% by the high performance infrared measurements,
but the mass spectrometric data is still unavailable to confirm.
The mass spectrometric (actual) and high performance infrared (predicted)
measurements are plotted to demonstrate the accuracy of the high performance
infrared predictions, Fig. 7. As mentioned above, the 1.6% sample is not closely
predicting the “actual” value and shows the highest error values. All other eight
samples predict accurately with an average standard deviation of 0.25%. The high
performance infrared predictions compared to the actual values (mass spectrometric)
are summarized in Table 1. The average measurement time per sample was ~5 min
for 10 scans. Increasing the number of measurements 10-fold, improves the sensitivity by 3.2 times, as demonstrated in Fig. 7 when comparing the average error of
~10 scans (purple line) to the individual measurement uncertainty values (red dots).
Therefore, the sensitivity can theoretically be improved by increasing the number of
measurements per sample to a finite extent and would depend on what is practical
for a measurement at a facility.
The high performance infrared results are compared to the International Atomic
Energy Agency’s International Target Values in Table 1. The high performance
infrared percent relative of the isotopic composition values fall between the International Target Values for nondestructive analysis (NDA, radiometric) and destructive