

Use of an Infrared Spectroscopic Method for Isotopic Analysis …
195
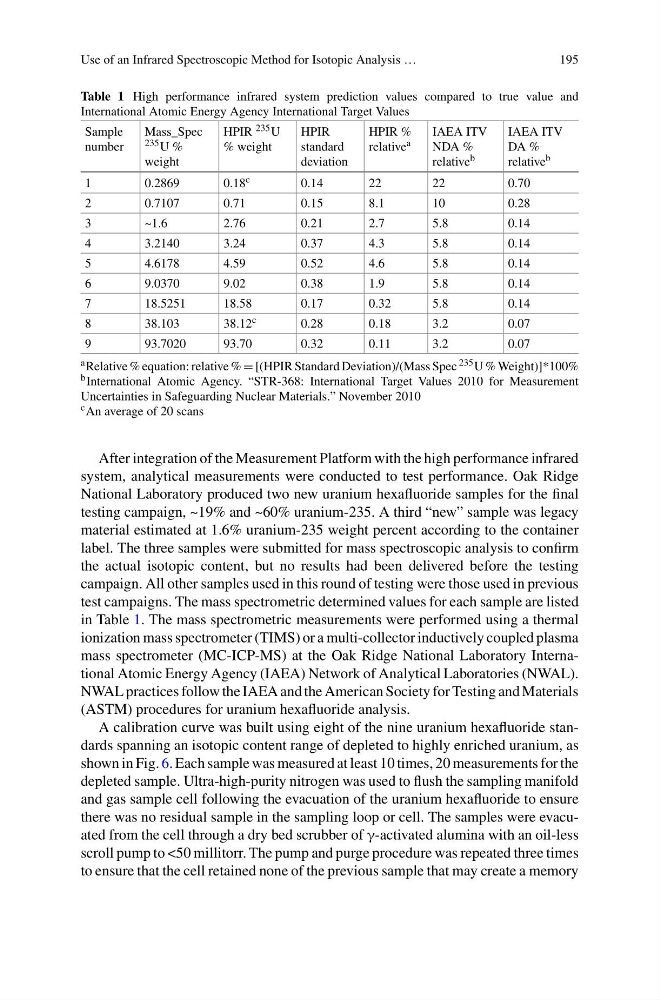
Table 1 High performance infrared system prediction values compared to true value and
International Atomic Energy Agency International Target Values
Sample
number
Mass_Spec
235 U %
weight
HPIR 235 U
% weight
HPIR
standard
deviation
HPIR %
relative a
IAEA ITV
NDA %
relative b
IAEA ITV
DA %
relative b
1
0.2869
0.18 c
0.14
22
22
0.70
2
0.7107
0.71
0.15
8.1
10
0.28
3
~1.6
2.76
0.21
2.7
5.8
0.14
4
3.2140
3.24
0.37
4.3
5.8
0.14
5
4.6178
4.59
0.52
4.6
5.8
0.14
6
9.0370
9.02
0.38
1.9
5.8
0.14
7
18.5251
18.58
0.17
0.32
5.8
0.14
8
38.103
38.12 c
0.28
0.18
3.2
0.07
9
93.7020
93.70
0.32
0.11
3.2
0.07
a Relative % equation: relative % = [(HPIR Standard Deviation)/(Mass Spec 235 U % Weight)]*100%
b International Atomic Agency. “STR-368: International Target Values 2010 for Measurement
Uncertainties in Safeguarding Nuclear Materials.” November 2010
c An average of 20 scans
After integration of the Measurement Platform with the high performance infrared
system, analytical measurements were conducted to test performance. Oak Ridge
National Laboratory produced two new uranium hexafluoride samples for the final
testing campaign, ~19% and ~60% uranium-235. A third “new” sample was legacy
material estimated at 1.6% uranium-235 weight percent according to the container
label. The three samples were submitted for mass spectroscopic analysis to confirm
the actual isotopic content, but no results had been delivered before the testing
campaign. All other samples used in this round of testing were those used in previous
test campaigns. The mass spectrometric determined values for each sample are listed
in Table 1. The mass spectrometric measurements were performed using a thermal
ionization mass spectrometer (TIMS) or a multi-collector inductively coupled plasma
mass spectrometer (MC-ICP-MS) at the Oak Ridge National Laboratory International Atomic Energy Agency (IAEA) Network of Analytical Laboratories (NWAL).
NWAL practices follow the IAEA and the American Society for Testing and Materials
(ASTM) procedures for uranium hexafluoride analysis.
A calibration curve was built using eight of the nine uranium hexafluoride standards spanning an isotopic content range of depleted to highly enriched uranium, as
shown in Fig. 6. Each sample was measured at least 10 times, 20 measurements for the
depleted sample. Ultra-high-purity nitrogen was used to flush the sampling manifold
and gas sample cell following the evacuation of the uranium hexafluoride to ensure
there was no residual sample in the sampling loop or cell. The samples were evacuated from the cell through a dry bed scrubber of γ-activated alumina with an oil-less
scroll pump to <50 millitorr. The pump and purge procedure was repeated three times
to ensure that the cell retained none of the previous sample that may create a memory
195
Table 1 High performance infrared system prediction values compared to true value and
International Atomic Energy Agency International Target Values
Sample
number
Mass_Spec
235 U %
weight
HPIR 235 U
% weight
HPIR
standard
deviation
HPIR %
relative a
IAEA ITV
NDA %
relative b
IAEA ITV
DA %
relative b
1
0.2869
0.18 c
0.14
22
22
0.70
2
0.7107
0.71
0.15
8.1
10
0.28
3
~1.6
2.76
0.21
2.7
5.8
0.14
4
3.2140
3.24
0.37
4.3
5.8
0.14
5
4.6178
4.59
0.52
4.6
5.8
0.14
6
9.0370
9.02
0.38
1.9
5.8
0.14
7
18.5251
18.58
0.17
0.32
5.8
0.14
8
38.103
38.12 c
0.28
0.18
3.2
0.07
9
93.7020
93.70
0.32
0.11
3.2
0.07
a Relative % equation: relative % = [(HPIR Standard Deviation)/(Mass Spec 235 U % Weight)]*100%
b International Atomic Agency. “STR-368: International Target Values 2010 for Measurement
Uncertainties in Safeguarding Nuclear Materials.” November 2010
c An average of 20 scans
After integration of the Measurement Platform with the high performance infrared
system, analytical measurements were conducted to test performance. Oak Ridge
National Laboratory produced two new uranium hexafluoride samples for the final
testing campaign, ~19% and ~60% uranium-235. A third “new” sample was legacy
material estimated at 1.6% uranium-235 weight percent according to the container
label. The three samples were submitted for mass spectroscopic analysis to confirm
the actual isotopic content, but no results had been delivered before the testing
campaign. All other samples used in this round of testing were those used in previous
test campaigns. The mass spectrometric determined values for each sample are listed
in Table 1. The mass spectrometric measurements were performed using a thermal
ionization mass spectrometer (TIMS) or a multi-collector inductively coupled plasma
mass spectrometer (MC-ICP-MS) at the Oak Ridge National Laboratory International Atomic Energy Agency (IAEA) Network of Analytical Laboratories (NWAL).
NWAL practices follow the IAEA and the American Society for Testing and Materials
(ASTM) procedures for uranium hexafluoride analysis.
A calibration curve was built using eight of the nine uranium hexafluoride standards spanning an isotopic content range of depleted to highly enriched uranium, as
shown in Fig. 6. Each sample was measured at least 10 times, 20 measurements for the
depleted sample. Ultra-high-purity nitrogen was used to flush the sampling manifold
and gas sample cell following the evacuation of the uranium hexafluoride to ensure
there was no residual sample in the sampling loop or cell. The samples were evacuated from the cell through a dry bed scrubber of γ-activated alumina with an oil-less
scroll pump to <50 millitorr. The pump and purge procedure was repeated three times
to ensure that the cell retained none of the previous sample that may create a memory