

A Comparative Study on the Effect of Graphene and Multi-walled …
153
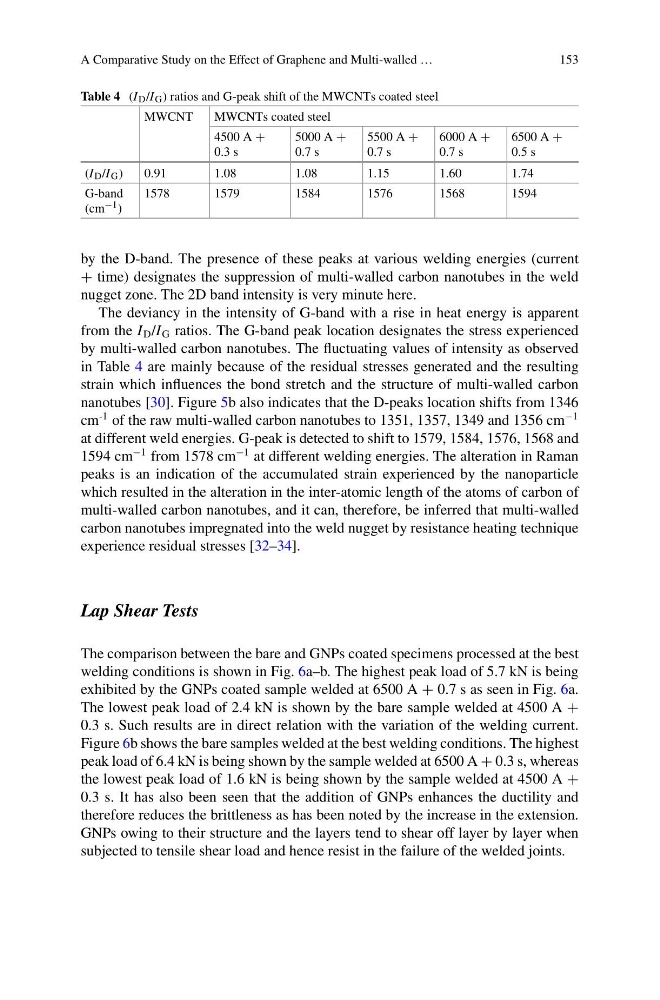
Table 4 (I D /I G ) ratios and G-peak shift of the MWCNTs coated steel
MWCNT
MWCNTs coated steel
4500 A +
0.3 s
5000 A +
0.7 s
5500 A +
0.7 s
6000 A +
0.7 s
6500 A +
0.5 s
(I D /I G )
0.91
1.08
1.08
1.15
1.60
1.74
G-band
(cm −1 )
1578
1579
1584
1576
1568
1594
by the D-band. The presence of these peaks at various welding energies (current
+ time) designates the suppression of multi-walled carbon nanotubes in the weld
nugget zone. The 2D band intensity is very minute here.
The deviancy in the intensity of G-band with a rise in heat energy is apparent
from the I D /I G ratios. The G-band peak location designates the stress experienced
by multi-walled carbon nanotubes. The fluctuating values of intensity as observed
in Table 4 are mainly because of the residual stresses generated and the resulting
strain which influences the bond stretch and the structure of multi-walled carbon
nanotubes [30]. Figure 5b also indicates that the D-peaks location shifts from 1346
cm
-1 of the raw multi-walled carbon nanotubes to 1351, 1357, 1349 and 1356 cm
−1
at different weld energies. G-peak is detected to shift to 1579, 1584, 1576, 1568 and
1594 cm
−1 from 1578 cm
−1 at different welding energies. The alteration in Raman
peaks is an indication of the accumulated strain experienced by the nanoparticle
which resulted in the alteration in the inter-atomic length of the atoms of carbon of
multi-walled carbon nanotubes, and it can, therefore, be inferred that multi-walled
carbon nanotubes impregnated into the weld nugget by resistance heating technique
experience residual stresses [32–34].
Lap Shear Tests
The comparison between the bare and GNPs coated specimens processed at the best
welding conditions is shown in Fig. 6a–b. The highest peak load of 5.7 kN is being
exhibited by the GNPs coated sample welded at 6500 A + 0.7 s as seen in Fig. 6a.
The lowest peak load of 2.4 kN is shown by the bare sample welded at 4500 A +
0.3 s. Such results are in direct relation with the variation of the welding current.
Figure 6b shows the bare samples welded at the best welding conditions. The highest
peak load of 6.4 kN is being shown by the sample welded at 6500 A + 0.3 s, whereas
the lowest peak load of 1.6 kN is being shown by the sample welded at 4500 A +
0.3 s. It has also been seen that the addition of GNPs enhances the ductility and
therefore reduces the brittleness as has been noted by the increase in the extension.
GNPs owing to their structure and the layers tend to shear off layer by layer when
subjected to tensile shear load and hence resist in the failure of the welded joints.
153
Table 4 (I D /I G ) ratios and G-peak shift of the MWCNTs coated steel
MWCNT
MWCNTs coated steel
4500 A +
0.3 s
5000 A +
0.7 s
5500 A +
0.7 s
6000 A +
0.7 s
6500 A +
0.5 s
(I D /I G )
0.91
1.08
1.08
1.15
1.60
1.74
G-band
(cm −1 )
1578
1579
1584
1576
1568
1594
by the D-band. The presence of these peaks at various welding energies (current
+ time) designates the suppression of multi-walled carbon nanotubes in the weld
nugget zone. The 2D band intensity is very minute here.
The deviancy in the intensity of G-band with a rise in heat energy is apparent
from the I D /I G ratios. The G-band peak location designates the stress experienced
by multi-walled carbon nanotubes. The fluctuating values of intensity as observed
in Table 4 are mainly because of the residual stresses generated and the resulting
strain which influences the bond stretch and the structure of multi-walled carbon
nanotubes [30]. Figure 5b also indicates that the D-peaks location shifts from 1346
cm
-1 of the raw multi-walled carbon nanotubes to 1351, 1357, 1349 and 1356 cm
−1
at different weld energies. G-peak is detected to shift to 1579, 1584, 1576, 1568 and
1594 cm
−1 from 1578 cm
−1 at different welding energies. The alteration in Raman
peaks is an indication of the accumulated strain experienced by the nanoparticle
which resulted in the alteration in the inter-atomic length of the atoms of carbon of
multi-walled carbon nanotubes, and it can, therefore, be inferred that multi-walled
carbon nanotubes impregnated into the weld nugget by resistance heating technique
experience residual stresses [32–34].
Lap Shear Tests
The comparison between the bare and GNPs coated specimens processed at the best
welding conditions is shown in Fig. 6a–b. The highest peak load of 5.7 kN is being
exhibited by the GNPs coated sample welded at 6500 A + 0.7 s as seen in Fig. 6a.
The lowest peak load of 2.4 kN is shown by the bare sample welded at 4500 A +
0.3 s. Such results are in direct relation with the variation of the welding current.
Figure 6b shows the bare samples welded at the best welding conditions. The highest
peak load of 6.4 kN is being shown by the sample welded at 6500 A + 0.3 s, whereas
the lowest peak load of 1.6 kN is being shown by the sample welded at 4500 A +
0.3 s. It has also been seen that the addition of GNPs enhances the ductility and
therefore reduces the brittleness as has been noted by the increase in the extension.
GNPs owing to their structure and the layers tend to shear off layer by layer when
subjected to tensile shear load and hence resist in the failure of the welded joints.