

152
T. Das
of graphene in the fused area. The 2D peak position is found out to be at around
2704 cm
−1 .
There is a variation in the G-band intensity with an increase in heat input, which is
evident from the I D /I G values. The G-band’s top position indicates the stress which
the graphene experiences. The varying intensity values indicate strain accumulation
affecting the bond length and the structure of graphene [30]. Figure 5a also shows that
the D-band’s peak position is shifting from 1351 cm
−1 of the as-received GNPs to
1344, 1349, 1355 and 1357 cm
−1 at various current/time settings. G-band is observed
to shift from 1581 to 1580, 1582, 1586 and 1587 cm
−1 at varying processing parameters. This shift in Raman bands is a mark of strained particle which results in a change
in the interatomic distance of graphene, and it can, therefore, be undoubtedly said
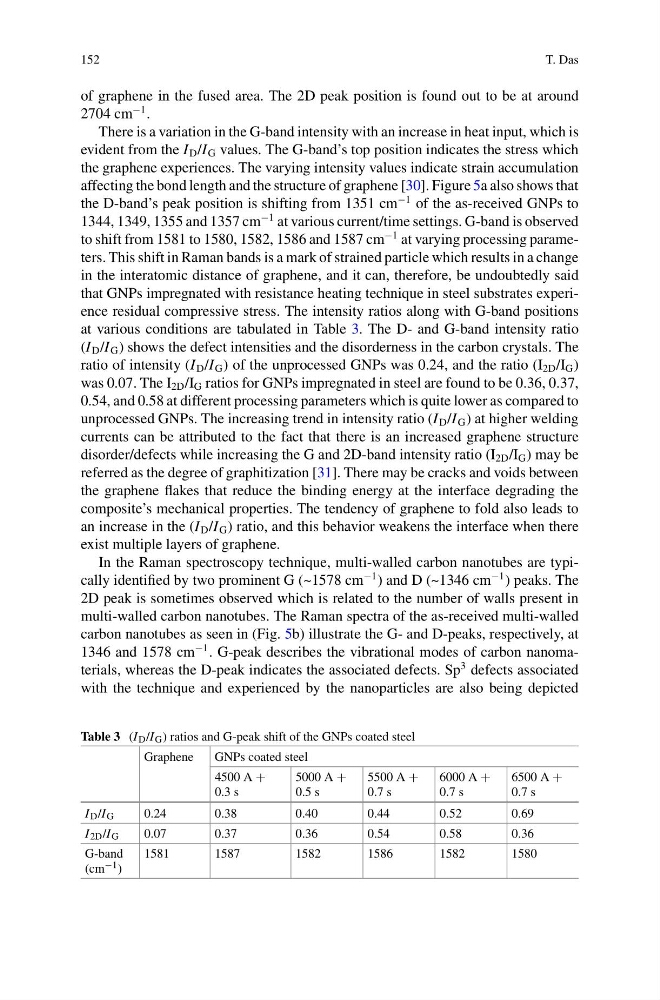
that GNPs impregnated with resistance heating technique in steel substrates experience residual compressive stress. The intensity ratios along with G-band positions
at various conditions are tabulated in Table 3. The D- and G-band intensity ratio
(I D /I G ) shows the defect intensities and the disorderness in the carbon crystals. The
ratio of intensity (I D /I G ) of the unprocessed GNPs was 0.24, and the ratio (I 2D /I G )
was 0.07. The I 2D /I G ratios for GNPs impregnated in steel are found to be 0.36, 0.37,
0.54, and 0.58 at different processing parameters which is quite lower as compared to
unprocessed GNPs. The increasing trend in intensity ratio (I D /I G ) at higher welding
currents can be attributed to the fact that there is an increased graphene structure
disorder/defects while increasing the G and 2D-band intensity ratio (I 2D /I G ) may be
referred as the degree of graphitization [31]. There may be cracks and voids between
the graphene flakes that reduce the binding energy at the interface degrading the
composite’s mechanical properties. The tendency of graphene to fold also leads to
an increase in the (I D /I G ) ratio, and this behavior weakens the interface when there
exist multiple layers of graphene.
In the Raman spectroscopy technique, multi-walled carbon nanotubes are typically identified by two prominent G (~1578 cm
−1 ) and D (~1346 cm
−1 ) peaks. The
2D peak is sometimes observed which is related to the number of walls present in
multi-walled carbon nanotubes. The Raman spectra of the as-received multi-walled
carbon nanotubes as seen in (Fig. 5b) illustrate the G- and D-peaks, respectively, at
1346 and 1578 cm
−1 . G-peak describes the vibrational modes of carbon nanomaterials, whereas the D-peak indicates the associated defects. Sp
3 defects associated
with the technique and experienced by the nanoparticles are also being depicted
Table 3 (I D /I G ) ratios and G-peak shift of the GNPs coated steel
Graphene
GNPs coated steel
4500 A +
0.3 s
5000 A +
0.5 s
5500 A +
0.7 s
6000 A +
0.7 s
6500 A +
0.7 s
I D /I G
0.24
0.38
0.40
0.44
0.52
0.69
I 2D /I G
0.07
0.37
0.36
0.54
0.58
0.36
G-band
(cm −1 )
1581
1587
1582
1586
1582
1580
T. Das
of graphene in the fused area. The 2D peak position is found out to be at around
2704 cm
−1 .
There is a variation in the G-band intensity with an increase in heat input, which is
evident from the I D /I G values. The G-band’s top position indicates the stress which
the graphene experiences. The varying intensity values indicate strain accumulation
affecting the bond length and the structure of graphene [30]. Figure 5a also shows that
the D-band’s peak position is shifting from 1351 cm
−1 of the as-received GNPs to
1344, 1349, 1355 and 1357 cm
−1 at various current/time settings. G-band is observed
to shift from 1581 to 1580, 1582, 1586 and 1587 cm
−1 at varying processing parameters. This shift in Raman bands is a mark of strained particle which results in a change
in the interatomic distance of graphene, and it can, therefore, be undoubtedly said
that GNPs impregnated with resistance heating technique in steel substrates experience residual compressive stress. The intensity ratios along with G-band positions
at various conditions are tabulated in Table 3. The D- and G-band intensity ratio
(I D /I G ) shows the defect intensities and the disorderness in the carbon crystals. The
ratio of intensity (I D /I G ) of the unprocessed GNPs was 0.24, and the ratio (I 2D /I G )
was 0.07. The I 2D /I G ratios for GNPs impregnated in steel are found to be 0.36, 0.37,
0.54, and 0.58 at different processing parameters which is quite lower as compared to
unprocessed GNPs. The increasing trend in intensity ratio (I D /I G ) at higher welding
currents can be attributed to the fact that there is an increased graphene structure
disorder/defects while increasing the G and 2D-band intensity ratio (I 2D /I G ) may be
referred as the degree of graphitization [31]. There may be cracks and voids between
the graphene flakes that reduce the binding energy at the interface degrading the
composite’s mechanical properties. The tendency of graphene to fold also leads to
an increase in the (I D /I G ) ratio, and this behavior weakens the interface when there
exist multiple layers of graphene.
In the Raman spectroscopy technique, multi-walled carbon nanotubes are typically identified by two prominent G (~1578 cm
−1 ) and D (~1346 cm
−1 ) peaks. The
2D peak is sometimes observed which is related to the number of walls present in
multi-walled carbon nanotubes. The Raman spectra of the as-received multi-walled
carbon nanotubes as seen in (Fig. 5b) illustrate the G- and D-peaks, respectively, at
1346 and 1578 cm
−1 . G-peak describes the vibrational modes of carbon nanomaterials, whereas the D-peak indicates the associated defects. Sp
3 defects associated
with the technique and experienced by the nanoparticles are also being depicted
Table 3 (I D /I G ) ratios and G-peak shift of the GNPs coated steel
Graphene
GNPs coated steel
4500 A +
0.3 s
5000 A +
0.5 s
5500 A +
0.7 s
6000 A +
0.7 s
6500 A +
0.7 s
I D /I G
0.24
0.38
0.40
0.44
0.52
0.69
I 2D /I G
0.07
0.37
0.36
0.54
0.58
0.36
G-band
(cm −1 )
1581
1587
1582
1586
1582
1580