

138
R. Goswami et al.
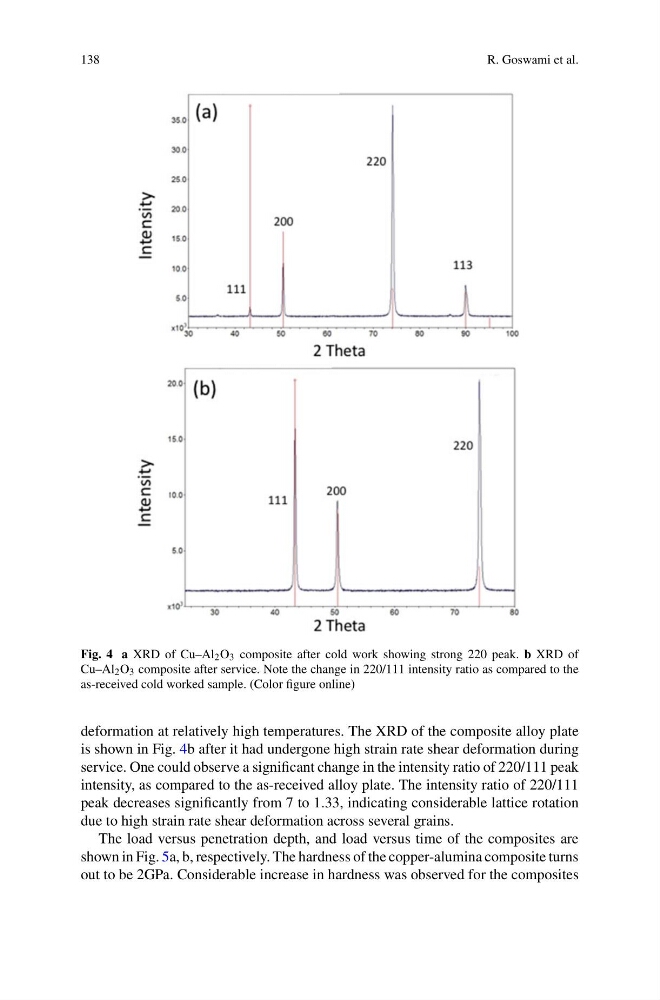
Fig. 4 a XRD of Cu–Al 2 O 3 composite after cold work showing strong 220 peak. b XRD of
Cu–Al 2 O 3 composite after service. Note the change in 220/111 intensity ratio as compared to the
as-received cold worked sample. (Color figure online)
deformation at relatively high temperatures. The XRD of the composite alloy plate
is shown in Fig. 4b after it had undergone high strain rate shear deformation during
service. One could observe a significant change in the intensity ratio of 220/111 peak
intensity, as compared to the as-received alloy plate. The intensity ratio of 220/111
peak decreases significantly from 7 to 1.33, indicating considerable lattice rotation
due to high strain rate shear deformation across several grains.
The load versus penetration depth, and load versus time of the composites are
shown in Fig. 5a, b, respectively. The hardness of the copper-alumina composite turns
out to be 2GPa. Considerable increase in hardness was observed for the composites
R. Goswami et al.
Fig. 4 a XRD of Cu–Al 2 O 3 composite after cold work showing strong 220 peak. b XRD of
Cu–Al 2 O 3 composite after service. Note the change in 220/111 intensity ratio as compared to the
as-received cold worked sample. (Color figure online)
deformation at relatively high temperatures. The XRD of the composite alloy plate
is shown in Fig. 4b after it had undergone high strain rate shear deformation during
service. One could observe a significant change in the intensity ratio of 220/111 peak
intensity, as compared to the as-received alloy plate. The intensity ratio of 220/111
peak decreases significantly from 7 to 1.33, indicating considerable lattice rotation
due to high strain rate shear deformation across several grains.
The load versus penetration depth, and load versus time of the composites are
shown in Fig. 5a, b, respectively. The hardness of the copper-alumina composite turns
out to be 2GPa. Considerable increase in hardness was observed for the composites