

After the evaluation of the boundary values of the initially planned design, a new
D-optimal design was planned (see Fig. 5) within the reduced design. Therefore,
16 experiments in a D-optimal design based on the reduced boundaries were planned
and experimentally performed as well as simulated. The experimentally performed
design was realized in 16 parallel shaking flask cultivations (approximately ten
samples per cultivation). For the evaluation of the DoE in mDoE, the responses
were only simulated. Both designs (experimental performed and simulated) were
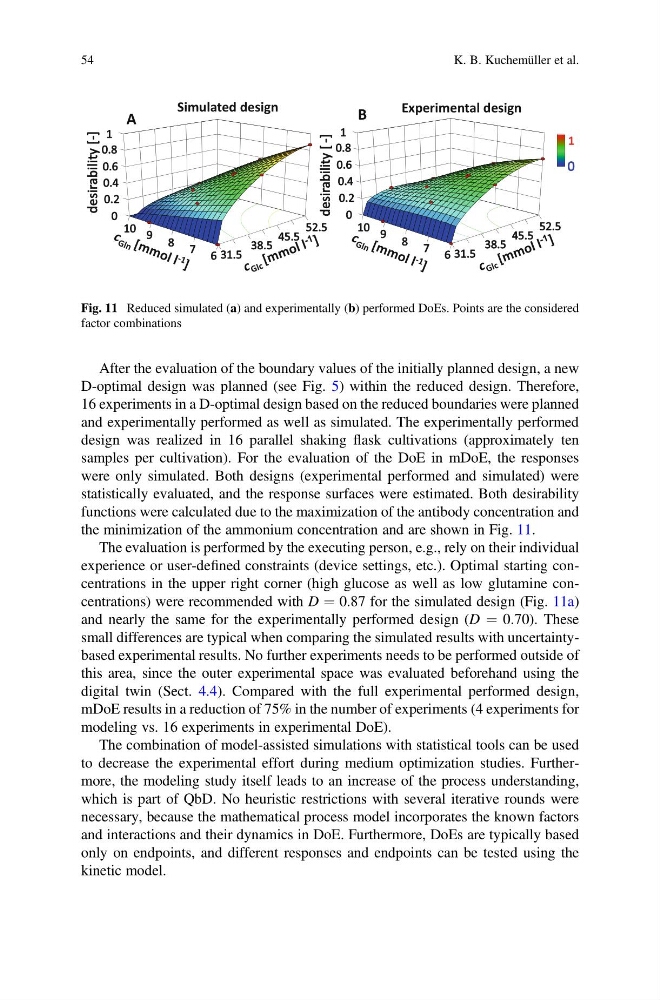
statistically evaluated, and the response surfaces were estimated. Both desirability
functions were calculated due to the maximization of the antibody concentration and
the minimization of the ammonium concentration and are shown in Fig. 11.
The evaluation is performed by the executing person, e.g., rely on their individual
experience or user-defined constraints (device settings, etc.). Optimal starting concentrations in the upper right corner (high glucose as well as low glutamine concentrations) were recommended with D ¼ 0.87 for the simulated design (Fig. 11a)
and nearly the same for the experimentally performed design (D ¼ 0.70). These
small differences are typical when comparing the simulated results with uncertaintybased experimental results. No further experiments needs to be performed outside of
this area, since the outer experimental space was evaluated beforehand using the
digital twin (Sect. 4.4). Compared with the full experimental performed design,
mDoE results in a reduction of 75% in the number of experiments (4 experiments for
modeling vs. 16 experiments in experimental DoE).
The combination of model-assisted simulations with statistical tools can be used
to decrease the experimental effort during medium optimization studies. Furthermore, the modeling study itself leads to an increase of the process understanding,
which is part of QbD. No heuristic restrictions with several iterative rounds were
necessary, because the mathematical process model incorporates the known factors
and interactions and their dynamics in DoE. Furthermore, DoEs are typically based
only on endpoints, and different responses and endpoints can be tested using the
kinetic model.
Simulated design
Experimental design
A
0 0
0 0. .2 2
0. 0.4 4
0 0. .6 6
0 0. .8 8
1 1
38 38. .5 5
31 31. .5 5
45 45. .5 5
52 52. .5 5
6 6
7 7
8 8
9 9
1 10 0
[ [
y y
t t
i i
l l
i i
b b
a a
r r
i i
s s
e e
d d
- -] ]
B
38 38. .5 5
31 31. .5 5
45 45. .5 5
52 52. .5 5
6 6
7 7
8 8
9 9
1 10 0
0 0
0 0. .2 2
0 0. .4 4
0 0. .6 6
0. 0.8 8
1 1
desi desir rabi abil lity ity [ [ - -] ]
1
0
Fig. 11 Reduced simulated (a) and experimentally (b) performed DoEs. Points are the considered
factor combinations
54
K. B. Kuchemüller et al.
D-optimal design was planned (see Fig. 5) within the reduced design. Therefore,
16 experiments in a D-optimal design based on the reduced boundaries were planned
and experimentally performed as well as simulated. The experimentally performed
design was realized in 16 parallel shaking flask cultivations (approximately ten
samples per cultivation). For the evaluation of the DoE in mDoE, the responses
were only simulated. Both designs (experimental performed and simulated) were
statistically evaluated, and the response surfaces were estimated. Both desirability
functions were calculated due to the maximization of the antibody concentration and
the minimization of the ammonium concentration and are shown in Fig. 11.
The evaluation is performed by the executing person, e.g., rely on their individual
experience or user-defined constraints (device settings, etc.). Optimal starting concentrations in the upper right corner (high glucose as well as low glutamine concentrations) were recommended with D ¼ 0.87 for the simulated design (Fig. 11a)
and nearly the same for the experimentally performed design (D ¼ 0.70). These
small differences are typical when comparing the simulated results with uncertaintybased experimental results. No further experiments needs to be performed outside of
this area, since the outer experimental space was evaluated beforehand using the
digital twin (Sect. 4.4). Compared with the full experimental performed design,
mDoE results in a reduction of 75% in the number of experiments (4 experiments for
modeling vs. 16 experiments in experimental DoE).
The combination of model-assisted simulations with statistical tools can be used
to decrease the experimental effort during medium optimization studies. Furthermore, the modeling study itself leads to an increase of the process understanding,
which is part of QbD. No heuristic restrictions with several iterative rounds were
necessary, because the mathematical process model incorporates the known factors
and interactions and their dynamics in DoE. Furthermore, DoEs are typically based
only on endpoints, and different responses and endpoints can be tested using the
kinetic model.
Simulated design
Experimental design
A
0 0
0 0. .2 2
0. 0.4 4
0 0. .6 6
0 0. .8 8
1 1
38 38. .5 5
31 31. .5 5
45 45. .5 5
52 52. .5 5
6 6
7 7
8 8
9 9
1 10 0
[ [
y y
t t
i i
l l
i i
b b
a a
r r
i i
s s
e e
d d
- -] ]
B
38 38. .5 5
31 31. .5 5
45 45. .5 5
52 52. .5 5
6 6
7 7
8 8
9 9
1 10 0
0 0
0 0. .2 2
0 0. .4 4
0 0. .6 6
0. 0.8 8
1 1
desi desir rabi abil lity ity [ [ - -] ]
1
0
Fig. 11 Reduced simulated (a) and experimentally (b) performed DoEs. Points are the considered
factor combinations
54
K. B. Kuchemüller et al.