

focused on. The goal could be a high cell density; therefore the representation of the
stationary phase and the death phase is not important. This must be taken into
account during the evaluation. Alternative measures are detailed explained in literature, e.g., [93, 94].
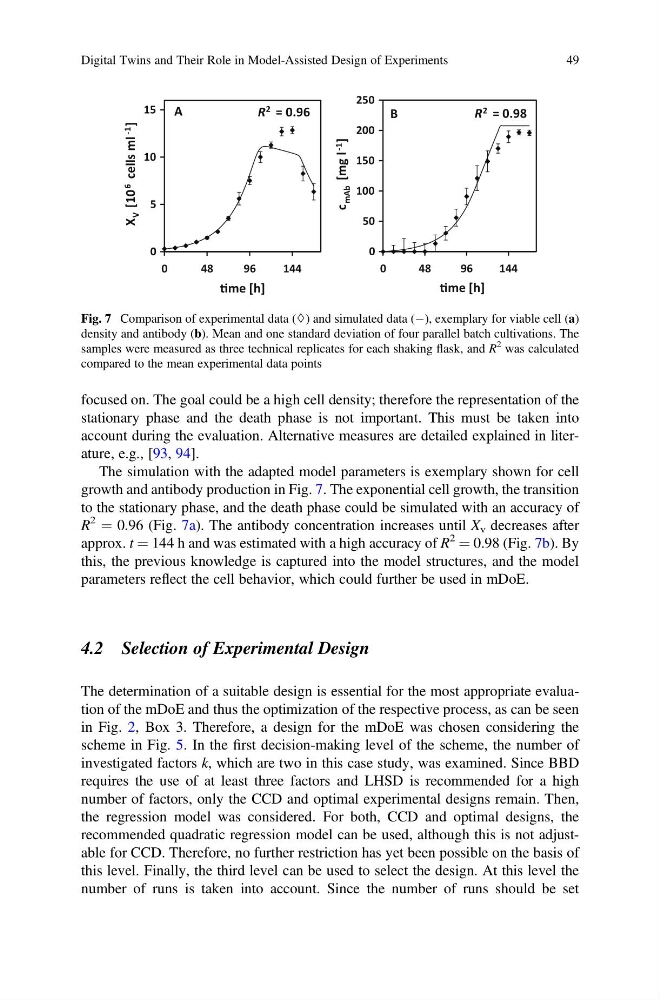
The simulation with the adapted model parameters is exemplary shown for cell
growth and antibody production in Fig. 7. The exponential cell growth, the transition
to the stationary phase, and the death phase could be simulated with an accuracy of
R
2
¼ 0.96 (Fig. 7a). The antibody concentration increases until X v decreases after
approx. t ¼ 144 h and was estimated with a high accuracy of R
2
¼ 0.98 (Fig. 7b). By
this, the previous knowledge is captured into the model structures, and the model
parameters reflect the cell behavior, which could further be used in mDoE.
4.2 Selection of Experimental Design
The determination of a suitable design is essential for the most appropriate evaluation of the mDoE and thus the optimization of the respective process, as can be seen
in Fig. 2, Box 3. Therefore, a design for the mDoE was chosen considering the
scheme in Fig. 5. In the first decision-making level of the scheme, the number of
investigated factors k, which are two in this case study, was examined. Since BBD
requires the use of at least three factors and LHSD is recommended for a high
number of factors, only the CCD and optimal experimental designs remain. Then,
the regression model was considered. For both, CCD and optimal designs, the
recommended quadratic regression model can be used, although this is not adjustable for CCD. Therefore, no further restriction has yet been possible on the basis of
this level. Finally, the third level can be used to select the design. At this level the
number of runs is taken into account. Since the number of runs should be set
0
5
10
15
0
4 8
9 6
1 4 4
X
V [10 6
l
m
s
l
l
e
c
-1
]
Ɵme [h]
A
R 2 = 0.96
0
50
100
150
200
250
0
4 8
9 6
1 4 4
c
mAb [mg l -1
]
Ɵme [h]
B
R 2 = 0.98
Fig. 7 Comparison of experimental data (◊) and simulated data (À), exemplary for viable cell (a)
density and antibody (b). Mean and one standard deviation of four parallel batch cultivations. The
samples were measured as three technical replicates for each shaking flask, and R
2 was calculated
compared to the mean experimental data points
Digital Twins and Their Role in Model-Assisted Design of Experiments
49
stationary phase and the death phase is not important. This must be taken into
account during the evaluation. Alternative measures are detailed explained in literature, e.g., [93, 94].
The simulation with the adapted model parameters is exemplary shown for cell
growth and antibody production in Fig. 7. The exponential cell growth, the transition
to the stationary phase, and the death phase could be simulated with an accuracy of
R
2
¼ 0.96 (Fig. 7a). The antibody concentration increases until X v decreases after
approx. t ¼ 144 h and was estimated with a high accuracy of R
2
¼ 0.98 (Fig. 7b). By
this, the previous knowledge is captured into the model structures, and the model
parameters reflect the cell behavior, which could further be used in mDoE.
4.2 Selection of Experimental Design
The determination of a suitable design is essential for the most appropriate evaluation of the mDoE and thus the optimization of the respective process, as can be seen
in Fig. 2, Box 3. Therefore, a design for the mDoE was chosen considering the
scheme in Fig. 5. In the first decision-making level of the scheme, the number of
investigated factors k, which are two in this case study, was examined. Since BBD
requires the use of at least three factors and LHSD is recommended for a high
number of factors, only the CCD and optimal experimental designs remain. Then,
the regression model was considered. For both, CCD and optimal designs, the
recommended quadratic regression model can be used, although this is not adjustable for CCD. Therefore, no further restriction has yet been possible on the basis of
this level. Finally, the third level can be used to select the design. At this level the
number of runs is taken into account. Since the number of runs should be set
0
5
10
15
0
4 8
9 6
1 4 4
X
V [10 6
l
m
s
l
l
e
c
-1
]
Ɵme [h]
A
R 2 = 0.96
0
50
100
150
200
250
0
4 8
9 6
1 4 4
c
mAb [mg l -1
]
Ɵme [h]
B
R 2 = 0.98
Fig. 7 Comparison of experimental data (◊) and simulated data (À), exemplary for viable cell (a)
density and antibody (b). Mean and one standard deviation of four parallel batch cultivations. The
samples were measured as three technical replicates for each shaking flask, and R
2 was calculated
compared to the mean experimental data points
Digital Twins and Their Role in Model-Assisted Design of Experiments
49