

individually, the CCD was discarded, and an optimal experimental design was
chosen.
Experiments were designed with suitable DoE software (in this study, DesignExpert 9, Statcon, USA), and each experimental factor combination of the experimental design was simulated (MATLAB). In the simulated design (20 experiments,
D-optimal design), the initial glucose concentration was varied between 20 and
60 mmol L
À1 . This corresponds to a 50% increase/decrease of the glucose concentrations related to the standard medium formulation as reported in Beckmann et al.
[91] and Wippmann et al. [92]. These studies did not focus on the optimization of the
batch-medium composition as aimed in this study. Glutamine concentrations typically applied in batch media range from 2 mmol L
À1 up to 8 mmol L
À1 . The factor
range of the initial glutamine concentration was, therefore, widely defined between
2 and 12 mmol L
À1 .
4.3 Simulation of Experiments
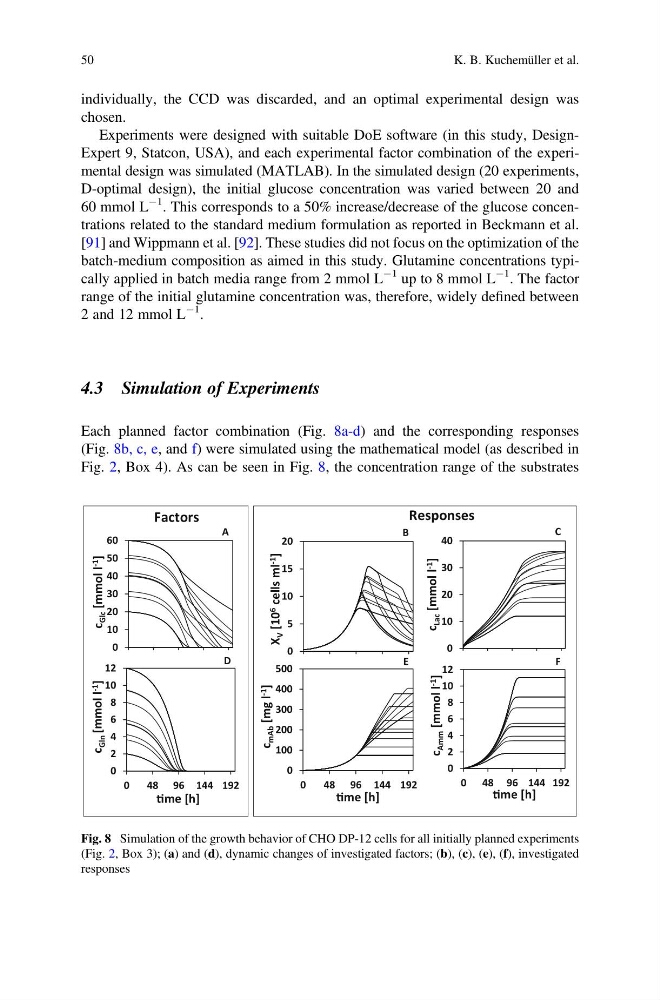
Each planned factor combination (Fig. 8a-d) and the corresponding responses
(Fig. 8b, c, e, and f) were simulated using the mathematical model (as described in
Fig. 2, Box 4). As can be seen in Fig. 8, the concentration range of the substrates
Factors
0
5
10
15
20
X
V [10 6
cells ml -1
]
0
10
20
30
40
50
60
c
Glc [
l
l
o
m
m
-1
]
0
2
4
6
8
10
12
0
48 96 144 192
c
Gln
l
l
o
m
m
[
-1
]
Ɵme [h]
0
100
200
300
400
500
0
48 96 144 192
c
mAb [mg l -1
]
Ɵme [h]
0
10
20
30
40
c
Lac [mmol l -1
]
0
2
4
6
8
10
12
0 48 96 144 192
c
Amm [mmol l -1
]
Ɵme [h]
Responses
A
B
C
D
E
F
Fig. 8 Simulation of the growth behavior of CHO DP-12 cells for all initially planned experiments
(Fig. 2, Box 3); (a) and (d), dynamic changes of investigated factors; (b), (c), (e), (f), investigated
responses
50
K. B. Kuchemüller et al.
chosen.
Experiments were designed with suitable DoE software (in this study, DesignExpert 9, Statcon, USA), and each experimental factor combination of the experimental design was simulated (MATLAB). In the simulated design (20 experiments,
D-optimal design), the initial glucose concentration was varied between 20 and
60 mmol L
À1 . This corresponds to a 50% increase/decrease of the glucose concentrations related to the standard medium formulation as reported in Beckmann et al.
[91] and Wippmann et al. [92]. These studies did not focus on the optimization of the
batch-medium composition as aimed in this study. Glutamine concentrations typically applied in batch media range from 2 mmol L
À1 up to 8 mmol L
À1 . The factor
range of the initial glutamine concentration was, therefore, widely defined between
2 and 12 mmol L
À1 .
4.3 Simulation of Experiments
Each planned factor combination (Fig. 8a-d) and the corresponding responses
(Fig. 8b, c, e, and f) were simulated using the mathematical model (as described in
Fig. 2, Box 4). As can be seen in Fig. 8, the concentration range of the substrates
Factors
0
5
10
15
20
X
V [10 6
cells ml -1
]
0
10
20
30
40
50
60
c
Glc [
l
l
o
m
m
-1
]
0
2
4
6
8
10
12
0
48 96 144 192
c
Gln
l
l
o
m
m
[
-1
]
Ɵme [h]
0
100
200
300
400
500
0
48 96 144 192
c
mAb [mg l -1
]
Ɵme [h]
0
10
20
30
40
c
Lac [mmol l -1
]
0
2
4
6
8
10
12
0 48 96 144 192
c
Amm [mmol l -1
]
Ɵme [h]
Responses
A
B
C
D
E
F
Fig. 8 Simulation of the growth behavior of CHO DP-12 cells for all initially planned experiments
(Fig. 2, Box 3); (a) and (d), dynamic changes of investigated factors; (b), (c), (e), (f), investigated
responses
50
K. B. Kuchemüller et al.