

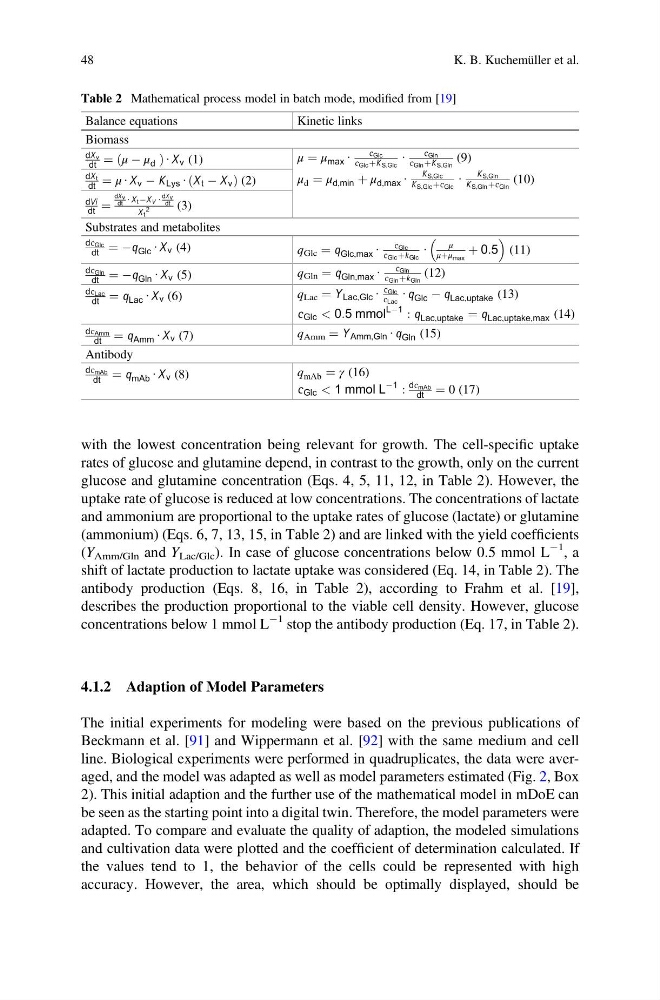
with the lowest concentration being relevant for growth. The cell-specific uptake
rates of glucose and glutamine depend, in contrast to the growth, only on the current
glucose and glutamine concentration (Eqs. 4, 5, 11, 12, in Table 2). However, the
uptake rate of glucose is reduced at low concentrations. The concentrations of lactate
and ammonium are proportional to the uptake rates of glucose (lactate) or glutamine
(ammonium) (Eqs. 6, 7, 13, 15, in Table 2) and are linked with the yield coefficients
(Y Amm/Gln and Y Lac/Glc ). In case of glucose concentrations below 0.5 mmol L
À1 , a
shift of lactate production to lactate uptake was considered (Eq. 14, in Table 2). The
antibody production (Eqs. 8, 16, in Table 2), according to Frahm et al. [19],
describes the production proportional to the viable cell density. However, glucose
concentrations below 1 mmol L
À1 stop the antibody production (Eq. 17, in Table 2).
4.1.2 Adaption of Model Parameters
The initial experiments for modeling were based on the previous publications of
Beckmann et al. [91] and Wippermann et al. [92] with the same medium and cell
line. Biological experiments were performed in quadruplicates, the data were averaged, and the model was adapted as well as model parameters estimated (Fig. 2, Box
2). This initial adaption and the further use of the mathematical model in mDoE can
be seen as the starting point into a digital twin. Therefore, the model parameters were
adapted. To compare and evaluate the quality of adaption, the modeled simulations
and cultivation data were plotted and the coefficient of determination calculated. If
the values tend to 1, the behavior of the cells could be represented with high
accuracy. However, the area, which should be optimally displayed, should be
Table 2 Mathematical process model in batch mode, modified from [19]
Balance equations
Kinetic links
Biomass
dX v
dt ¼ μ À μ d
ð
Þ∙ X v (1)
μ ¼ μ max ∙
c Glc
c Glc þK S,Glc
∙
c Gln
c Gln þK S,Gln
(9)
μ d ¼ μ d,min þ μ d,max ∙
K S,Glc
K S,Glc þc Glc
∙
K S,Gln
K S,Gln þc Gln
(10)
dX t
dt ¼ μ ∙ X v À K Lys ∙ X t À X v
ð
Þ(2)
dVi
dt ¼
dX v
dt ∙ X t ÀX V ∙
dX v
dt
X t
2
(3)
Substrates and metabolites
dc Glc
dt ¼ Àq Glc ∙ X v (4)
q Glc ¼ q Glc,max ∙
c Glc
c Glc þk Glc
∙
μ
μþμ max
þ 0:5
(11)
dc Gln
dt ¼ Àq Gln ∙ X v (5)
q Gln ¼ q Gln,max ∙
c Gln
c Gln þk Gln
(12)
dcLac
dt ¼ q Lac ∙ X v (6)
q Lac ¼ Y Lac,Glc ∙
c Glc
cLac ∙ q Glc À q Lac,uptake (13)
c Glc < 0:5 mmol
LÀ1 : q Lac,uptake ¼ q Lac,uptake,max (14)
dcAmm
dt ¼ q Amm ∙ X v (7)
q Amm ¼ Y Amm,Gln ∙ q Gln (15)
Antibody
dcmAb
dt ¼ q mAb ∙ X v (8)
q mAb ¼ γ (16)
c Glc < 1 mmol L
À1 :
dcmAb
dt ¼ 0 (17)
48
K. B. Kuchemüller et al.
rates of glucose and glutamine depend, in contrast to the growth, only on the current
glucose and glutamine concentration (Eqs. 4, 5, 11, 12, in Table 2). However, the
uptake rate of glucose is reduced at low concentrations. The concentrations of lactate
and ammonium are proportional to the uptake rates of glucose (lactate) or glutamine
(ammonium) (Eqs. 6, 7, 13, 15, in Table 2) and are linked with the yield coefficients
(Y Amm/Gln and Y Lac/Glc ). In case of glucose concentrations below 0.5 mmol L
À1 , a
shift of lactate production to lactate uptake was considered (Eq. 14, in Table 2). The
antibody production (Eqs. 8, 16, in Table 2), according to Frahm et al. [19],
describes the production proportional to the viable cell density. However, glucose
concentrations below 1 mmol L
À1 stop the antibody production (Eq. 17, in Table 2).
4.1.2 Adaption of Model Parameters
The initial experiments for modeling were based on the previous publications of
Beckmann et al. [91] and Wippermann et al. [92] with the same medium and cell
line. Biological experiments were performed in quadruplicates, the data were averaged, and the model was adapted as well as model parameters estimated (Fig. 2, Box
2). This initial adaption and the further use of the mathematical model in mDoE can
be seen as the starting point into a digital twin. Therefore, the model parameters were
adapted. To compare and evaluate the quality of adaption, the modeled simulations
and cultivation data were plotted and the coefficient of determination calculated. If
the values tend to 1, the behavior of the cells could be represented with high
accuracy. However, the area, which should be optimally displayed, should be
Table 2 Mathematical process model in batch mode, modified from [19]
Balance equations
Kinetic links
Biomass
dX v
dt ¼ μ À μ d
ð
Þ∙ X v (1)
μ ¼ μ max ∙
c Glc
c Glc þK S,Glc
∙
c Gln
c Gln þK S,Gln
(9)
μ d ¼ μ d,min þ μ d,max ∙
K S,Glc
K S,Glc þc Glc
∙
K S,Gln
K S,Gln þc Gln
(10)
dX t
dt ¼ μ ∙ X v À K Lys ∙ X t À X v
ð
Þ(2)
dVi
dt ¼
dX v
dt ∙ X t ÀX V ∙
dX v
dt
X t
2
(3)
Substrates and metabolites
dc Glc
dt ¼ Àq Glc ∙ X v (4)
q Glc ¼ q Glc,max ∙
c Glc
c Glc þk Glc
∙
μ
μþμ max
þ 0:5
(11)
dc Gln
dt ¼ Àq Gln ∙ X v (5)
q Gln ¼ q Gln,max ∙
c Gln
c Gln þk Gln
(12)
dcLac
dt ¼ q Lac ∙ X v (6)
q Lac ¼ Y Lac,Glc ∙
c Glc
cLac ∙ q Glc À q Lac,uptake (13)
c Glc < 0:5 mmol
LÀ1 : q Lac,uptake ¼ q Lac,uptake,max (14)
dcAmm
dt ¼ q Amm ∙ X v (7)
q Amm ¼ Y Amm,Gln ∙ q Gln (15)
Antibody
dcmAb
dt ¼ q mAb ∙ X v (8)
q mAb ¼ γ (16)
c Glc < 1 mmol L
À1 :
dcmAb
dt ¼ 0 (17)
48
K. B. Kuchemüller et al.