

defined functions (UDFs). The approach is called “one-way” coupling illustrating
that particles do not affect the background flow field which is “frozen” in pseudosteady state. For this purpose 100,000 particles are introduced into the reactor.
Criteria for choosing the number of particles are discussed in the literature [14, 25,
30].
To analyze lifelines with respect to regime shifts, the common approach is to
consider the time duration between two consecutive regime transitions as the
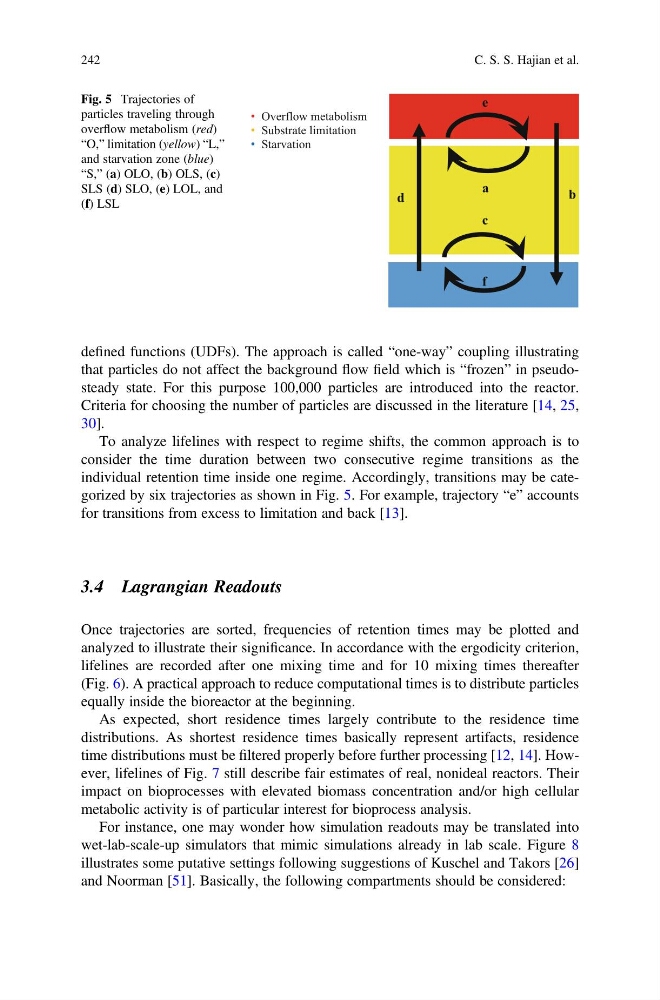
individual retention time inside one regime. Accordingly, transitions may be categorized by six trajectories as shown in Fig. 5. For example, trajectory “e” accounts
for transitions from excess to limitation and back [13].
3.4 Lagrangian Readouts
Once trajectories are sorted, frequencies of retention times may be plotted and
analyzed to illustrate their significance. In accordance with the ergodicity criterion,
lifelines are recorded after one mixing time and for 10 mixing times thereafter
(Fig. 6). A practical approach to reduce computational times is to distribute particles
equally inside the bioreactor at the beginning.
As expected, short residence times largely contribute to the residence time
distributions. As shortest residence times basically represent artifacts, residence
time distributions must be filtered properly before further processing [12, 14]. However, lifelines of Fig. 7 still describe fair estimates of real, nonideal reactors. Their
impact on bioprocesses with elevated biomass concentration and/or high cellular
metabolic activity is of particular interest for bioprocess analysis.
For instance, one may wonder how simulation readouts may be translated into
wet-lab-scale-up simulators that mimic simulations already in lab scale. Figure 8
illustrates some putative settings following suggestions of Kuschel and Takors [26]
and Noorman [51]. Basically, the following compartments should be considered:
a
b
c
d
e
f
• Overflow metabolism
• Substrate limitation
• Starvation
Fig. 5 Trajectories of
particles traveling through
overflow metabolism (red)
“O,” limitation (yellow) “L,”
and starvation zone (blue)
“S,” (a) OLO, (b) OLS, (c)
SLS (d) SLO, (e) LOL, and
(f) LSL
242
C. S. S. Hajian et al.
that particles do not affect the background flow field which is “frozen” in pseudosteady state. For this purpose 100,000 particles are introduced into the reactor.
Criteria for choosing the number of particles are discussed in the literature [14, 25,
30].
To analyze lifelines with respect to regime shifts, the common approach is to
consider the time duration between two consecutive regime transitions as the
individual retention time inside one regime. Accordingly, transitions may be categorized by six trajectories as shown in Fig. 5. For example, trajectory “e” accounts
for transitions from excess to limitation and back [13].
3.4 Lagrangian Readouts
Once trajectories are sorted, frequencies of retention times may be plotted and
analyzed to illustrate their significance. In accordance with the ergodicity criterion,
lifelines are recorded after one mixing time and for 10 mixing times thereafter
(Fig. 6). A practical approach to reduce computational times is to distribute particles
equally inside the bioreactor at the beginning.
As expected, short residence times largely contribute to the residence time
distributions. As shortest residence times basically represent artifacts, residence
time distributions must be filtered properly before further processing [12, 14]. However, lifelines of Fig. 7 still describe fair estimates of real, nonideal reactors. Their
impact on bioprocesses with elevated biomass concentration and/or high cellular
metabolic activity is of particular interest for bioprocess analysis.
For instance, one may wonder how simulation readouts may be translated into
wet-lab-scale-up simulators that mimic simulations already in lab scale. Figure 8
illustrates some putative settings following suggestions of Kuschel and Takors [26]
and Noorman [51]. Basically, the following compartments should be considered:
a
b
c
d
e
f
• Overflow metabolism
• Substrate limitation
• Starvation
Fig. 5 Trajectories of
particles traveling through
overflow metabolism (red)
“O,” limitation (yellow) “L,”
and starvation zone (blue)
“S,” (a) OLO, (b) OLS, (c)
SLS (d) SLO, (e) LOL, and
(f) LSL
242
C. S. S. Hajian et al.